Toggle navigation
Home
Contact
Login
Register
Home
Tag : Word Clouds
Tag : Word Clouds
Popular Posts
Khewra Mine Salt
28.12.2023
0 Comments
Google history: When Was Google Founded and By Whom?
31.10.2024
0 Comments
Waterfalls: Sajikot Waterfall
05.12.2023
0 Comments
free software download websites for pc
21.09.2023
0 Comments
10 Latest PLC Technology Trends
21.10.2023
0 Comments
Magic Spoon Cereal Review
28.10.2023
0 Comments
Categories
AUTO
(23)
HEALTH and Food
(195)
TESTIMONIALS (References)
(0)
SPORTS
(12)
IT and AI
(70)
Accessories
(0)
News
(167)
Pet
(15)
Visiting Place News
(24)
Style and Fashion news
(25)
Geography News
(0)
Entertainment News
(0)
Random Posts
Visiting Place News
Experiences that will leave you breathless
News
Best Laptop for Gaming and School
HEALTH and Food
30 Great Recipes Using Only Freezer Essentials
News
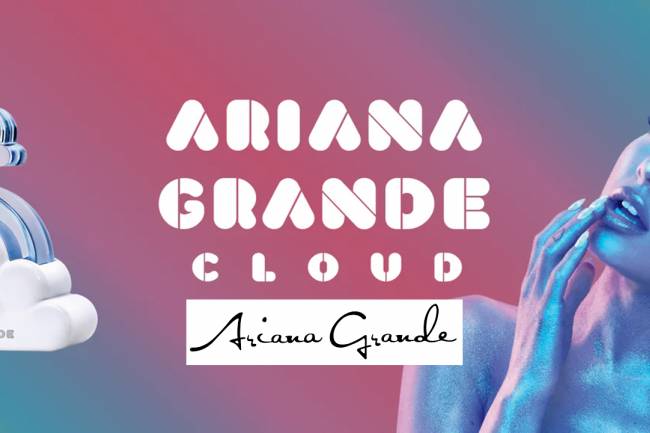
Ariana Grande Perfumes: Famous Nice Perfumes: Cloud Perfumes
IT and AI
Public awareness and education about AI
Tags
#EmergingTalent.
Text Box Data Binding
Brenda Lee family
Blue Lagoon Iceland Oasis Bar
mindfulness
Eau de Toilette (EDT)
Honda 2025 Release Date
food
Eclipse and Nature
Fantasy football
big data
Grief in sports
Bird Breeding Seasons
Mood stabilizer
sleep tracking
Your browser does not support the canvas element.