Toggle navigation
Home
Contact
Login
Register
Home
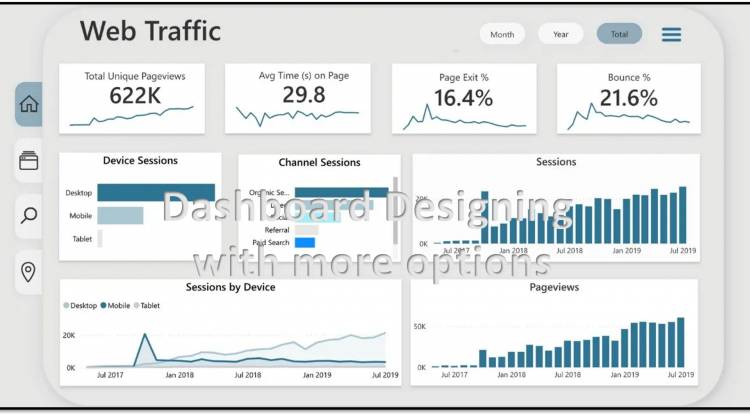
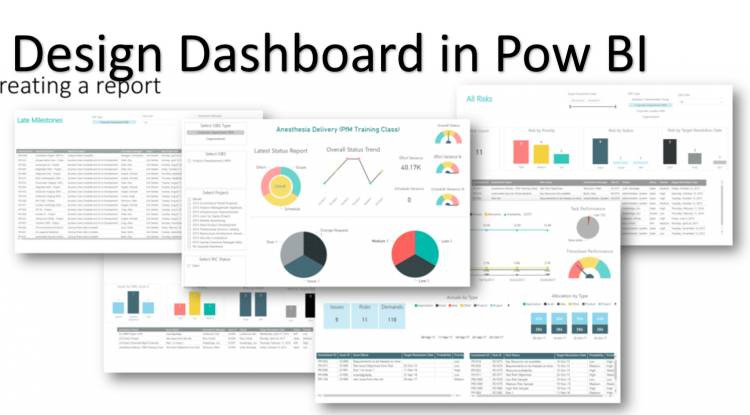
Tag : Chart types
Tag : Chart types
Popular Posts
Khewra Mine Salt
28.12.2023
0 Comments
Google history: When Was Google Founded and By Whom?
31.10.2024
0 Comments
Waterfalls: Sajikot Waterfall
05.12.2023
0 Comments
free software download websites for pc
21.09.2023
0 Comments
10 Latest PLC Technology Trends
21.10.2023
0 Comments
Magic Spoon Cereal Review
28.10.2023
0 Comments
Categories
AUTO
(23)
HEALTH and Food
(195)
TESTIMONIALS (References)
(0)
SPORTS
(12)
IT and AI
(70)
Accessories
(0)
News
(167)
Pet
(15)
Visiting Place News
(24)
Style and Fashion news
(25)
Geography News
(0)
Entertainment News
(0)
Random Posts
AUTO
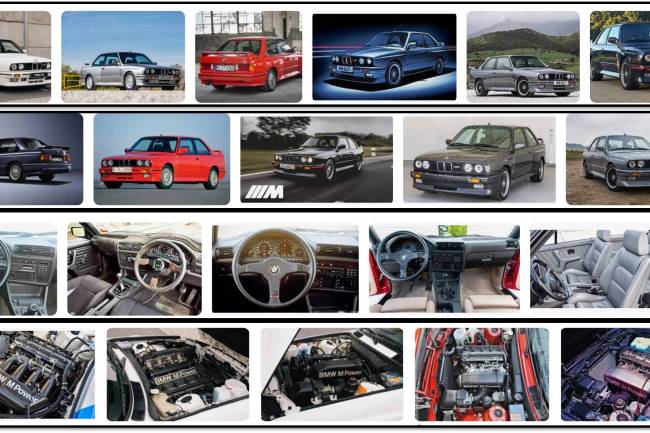
1986 BMW M3 E30: classic box-arched splendors
HEALTH and Food
Which vegetables and fruits contain anti-aging ingredients?
News
Autism Awareness and Mississippi
Visiting Place News
Europe's 20 Most Underrated Destinations for 2025 Part-5
AUTO
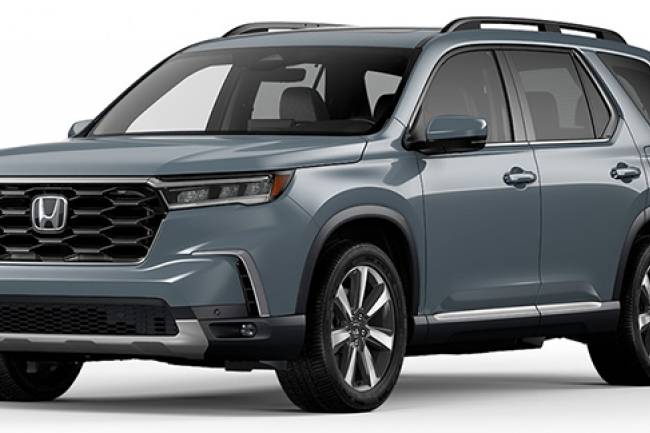
2025 Honda Pilot Details
Tags
From electric whispers to roaring engines
AI chatbots
Home Depot garage flooring
Celebrity Competition
ShopPinkFriday
mindfulness
Bird Behavior Studies
Data standardization
Trendsetting
Parrot
Jennifer Aniston's salad creativity
Celebrity salad secrets
Cricket wireless 5G network
PDF in Word
Side effects awareness
Your browser does not support the canvas element.