Toggle navigation
Home
Contact
Login
Register
Home
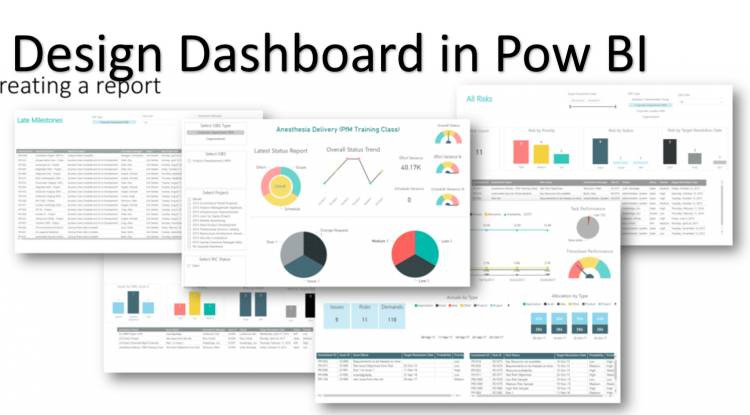
Tag : Dashboard responsiveness
Tag : Dashboard responsiveness
Popular Posts
Khewra Mine Salt
28.12.2023
0 Comments
Google history: When Was Google Founded and By Whom?
31.10.2024
0 Comments
Waterfalls: Sajikot Waterfall
05.12.2023
0 Comments
free software download websites for pc
21.09.2023
0 Comments
10 Latest PLC Technology Trends
21.10.2023
0 Comments
Magic Spoon Cereal Review
28.10.2023
0 Comments
Categories
AUTO
(23)
HEALTH and Food
(195)
TESTIMONIALS (References)
(0)
SPORTS
(12)
IT and AI
(70)
Accessories
(0)
News
(167)
Pet
(15)
Visiting Place News
(24)
Style and Fashion news
(25)
Geography News
(0)
Entertainment News
(0)
Random Posts
IT and AI
AI Literacy: extensive information
News
Non-Disney/Pixar Animated Movies Best of 20
IT and AI
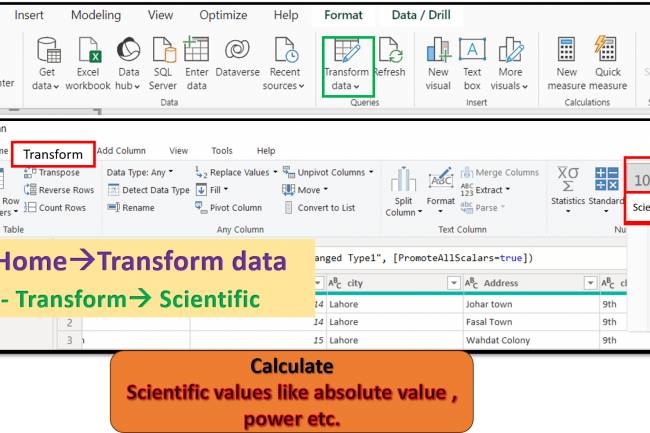
Transform Tab in Query Editor: Statistic option of query editor like absolute...
HEALTH and Food
26 Delicious Recipes to Transform Your Leftovers
News
AI-Assisted Human-Enhanced Content Detail
Tags
walk-off
stress triggers
PLC in CNC Wire EDM
Music
hybrid prototypes
Lymphatic system
Plant-Based Recipes
species diversity
Lake Saif-ul-Malook
Omit Columns
clinically proven
melons
The Home Depot paint rollers
Skin
Valhalla
Your browser does not support the canvas element.