Toggle navigation
Home
Contact
Login
Register
Home
Tag : Graphical representation
Tag : Graphical representation
Popular Posts
Khewra Mine Salt
28.12.2023
0 Comments
Google history: When Was Google Founded and By Whom?
31.10.2024
0 Comments
free software download websites for pc
21.09.2023
0 Comments
10 Latest PLC Technology Trends
21.10.2023
0 Comments
Waterfalls: Sajikot Waterfall
05.12.2023
0 Comments
Magic Spoon Cereal Review
28.10.2023
0 Comments
Categories
AUTO
(23)
HEALTH and Food
(195)
TESTIMONIALS (References)
(0)
SPORTS
(12)
IT and AI
(70)
Accessories
(0)
News
(167)
Pet
(15)
Visiting Place News
(24)
Style and Fashion news
(25)
Geography News
(0)
Entertainment News
(0)
Random Posts
IT and AI
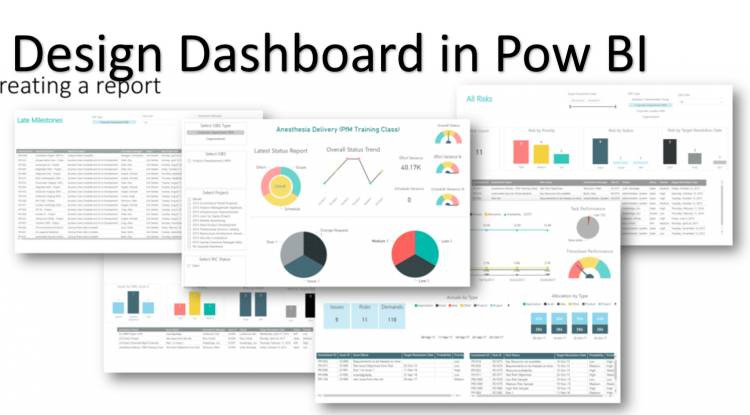
Microsoft Power BI Table of Contents: Lessons Index
HEALTH and Food
Exercise For Muscle Gain at Home for Female
Style and Fashion news
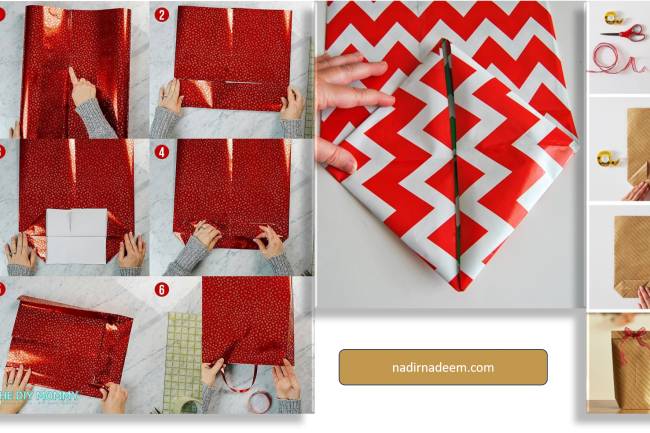
How To Style a Bag Out Of Wrapping Paper
HEALTH and Food
Tatcha Pure One Step Camellia Cleansing Oil:Recipe
AUTO
2025 Honda Pilot Details
Tags
Automation in Customer Onboarding
bibimbap
PLC in Building Automation
Poor Richard's Almanack
Game wins
Eid clothes
nadeem
Acne Care
modern bridal wear
Productivity
Always use boiling water to blanch vegetables
Best gaming laptops for FPS games
weather alerts
sibling support
Legacy
Your browser does not support the canvas element.