Toggle navigation
Home
Contact
Login
Register
Home
Tag : Graphs
Tag : Graphs
Popular Posts
Khewra Mine Salt
28.12.2023
0 Comments
Google history: When Was Google Founded and By Whom?
31.10.2024
0 Comments
Waterfalls: Sajikot Waterfall
05.12.2023
0 Comments
free software download websites for pc
21.09.2023
0 Comments
10 Latest PLC Technology Trends
21.10.2023
0 Comments
Magic Spoon Cereal Review
28.10.2023
0 Comments
Categories
AUTO
(23)
HEALTH and Food
(195)
TESTIMONIALS (References)
(0)
SPORTS
(12)
IT and AI
(70)
Accessories
(0)
News
(167)
Pet
(15)
Visiting Place News
(24)
Style and Fashion news
(25)
Geography News
(0)
Entertainment News
(0)
Random Posts
News
The Burnt Toast Theory
News
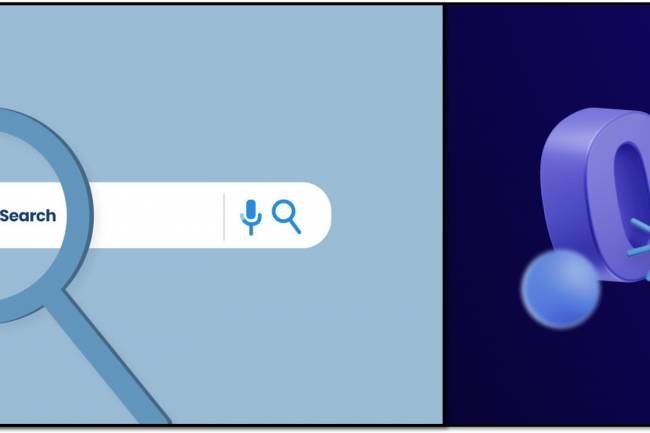
Zero-Click SEO Optimization tool free detail
HEALTH and Food
Physiotherapist's opinion on spas
HEALTH and Food
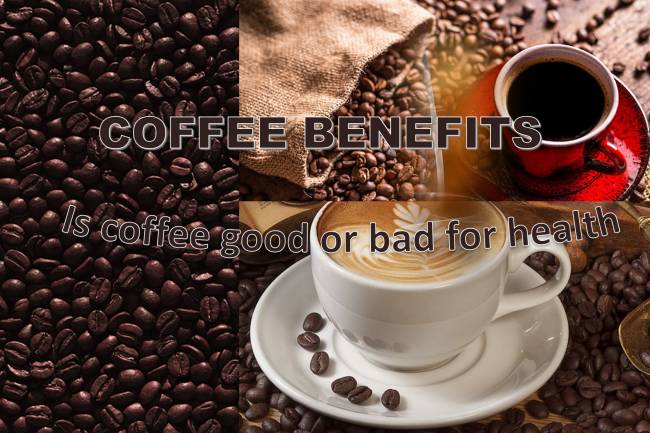
Coffee: What are the Benefits of Coffee to People’s Health? : Advantages...
News
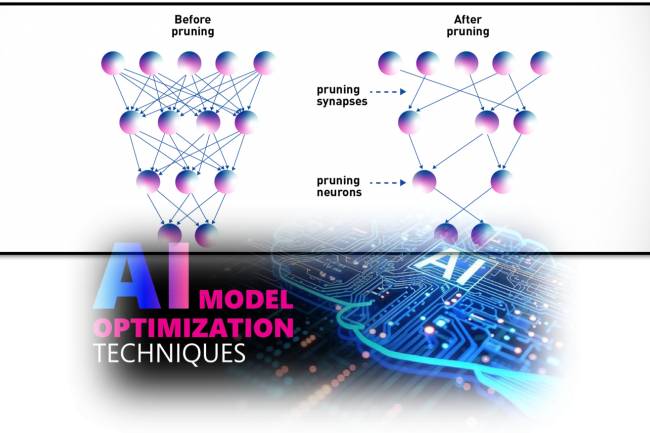
AI Model Optimization
Tags
AI chatbots
First-class
Processed Foods
privacy
fashion trends
experienced digital marketing freelancer
Dashboard Design
Delicious Curry
Daylight Saving Time Observance
SaintPatricksDay
To Start
Quaker Parrot molting
ride-sharing
Pregnancy
Natural fertilizer
Your browser does not support the canvas element.