Toggle navigation
Home
Contact
Login
Register
Home
Tag : Motion Infographics
Tag : Motion Infographics
Popular Posts
Khewra Mine Salt
28.12.2023
0 Comments
Waterfalls: Sajikot Waterfall
05.12.2023
0 Comments
Google history: When Was Google Founded and By Whom?
31.10.2024
0 Comments
free software download websites for pc
21.09.2023
0 Comments
10 Latest PLC Technology Trends
21.10.2023
0 Comments
Magic Spoon Cereal Review
28.10.2023
0 Comments
Categories
AUTO
(23)
HEALTH and Food
(195)
TESTIMONIALS (References)
(0)
SPORTS
(12)
IT and AI
(70)
Accessories
(0)
News
(167)
Pet
(15)
Visiting Place News
(24)
Style and Fashion news
(25)
Geography News
(0)
Entertainment News
(0)
Random Posts
News
Locating T-Mobile Stores Near You: Easy Steps and Options
HEALTH and Food
Functional Foods: Ingredients and Benefits
News
Google Pixel 8 pro | Google Pixel 8 | google pixel 8 release date
News
Brenda Lee: How Tall is Brenda Lee
News
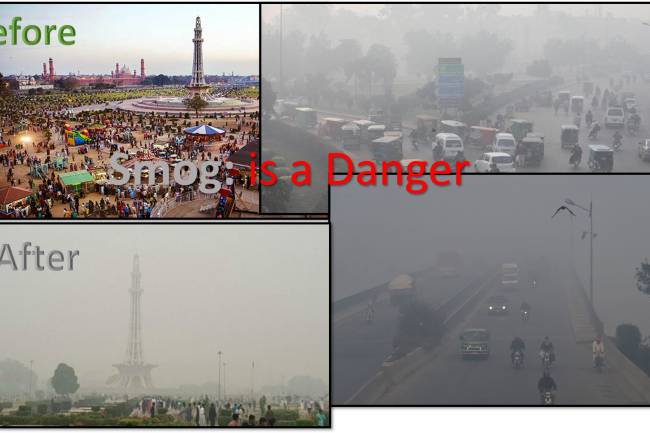
Smog: is a Danger
Tags
sustainable AI
Gallo Pinto
A Symphony of Sights and Sounds
To Upper Right One
Moringa purity
Information architecture
NFL scores and fantasy football
Honda Accord 2025 Interior
AI for good
Goffin's Cockatoo breeders
Particulate Matter
performance
Immune health
AFC East Schedule 2023
B1
Your browser does not support the canvas element.