Toggle navigation
Home
Contact
Login
Register
Home
Tag : User engagement
Tag : User engagement
Popular Posts
Khewra Mine Salt
28.12.2023
0 Comments
Google history: When Was Google Founded and By Whom?
31.10.2024
0 Comments
free software download websites for pc
21.09.2023
0 Comments
10 Latest PLC Technology Trends
21.10.2023
0 Comments
Waterfalls: Sajikot Waterfall
05.12.2023
0 Comments
Magic Spoon Cereal Review
28.10.2023
0 Comments
Categories
AUTO
(23)
HEALTH and Food
(195)
TESTIMONIALS (References)
(0)
SPORTS
(12)
IT and AI
(70)
Accessories
(0)
News
(167)
Pet
(15)
Visiting Place News
(24)
Style and Fashion news
(25)
Geography News
(0)
Entertainment News
(0)
Random Posts
News
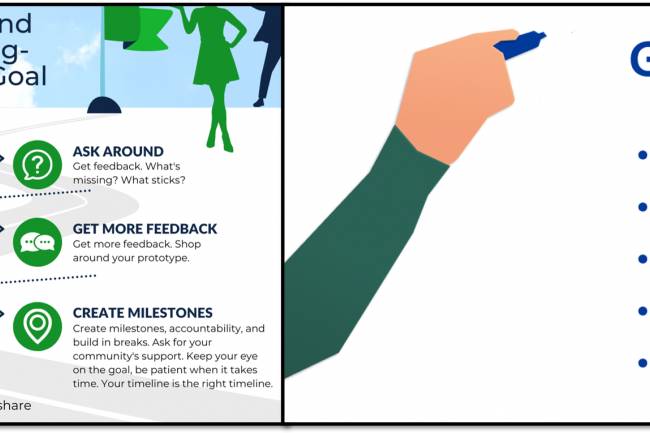
How To Achieve "Career Goals"
News
What is JAPANDI: Japan and Scandinavian ?
News
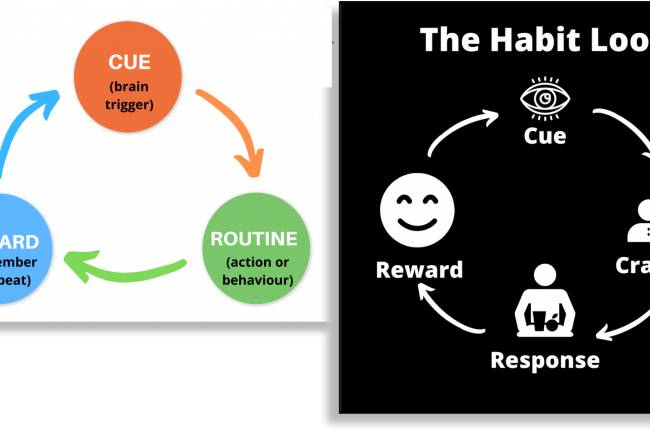
what is a habit loop
News
Momotaro Jeans is a high-end Japanese denim
HEALTH and Food
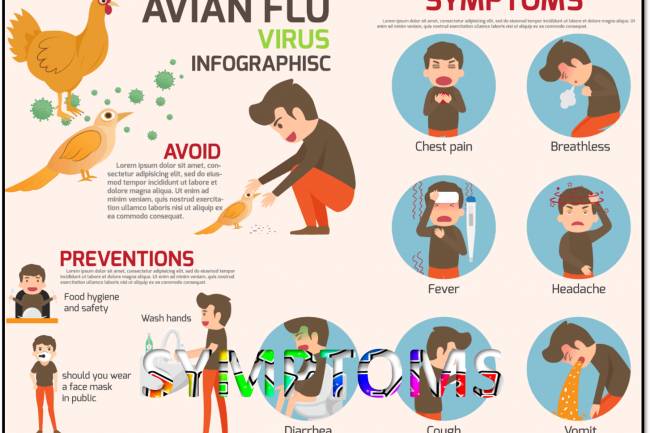
Bird Flu Symptoms
Tags
Introduction to Power BI
Immune suppressants
genetic disease
Bird socialization
Ingenious
PC
Easter Sunday: April 20
White
Celtics matches
Romantic perfumes
To Bottom
Jails
download ms word cracked
VideoProduction
lean proteins
Your browser does not support the canvas element.