Toggle navigation
Home
Contact
Login
Register
Home
Tag : User interface
Tag : User interface
Popular Posts
Khewra Mine Salt
28.12.2023
0 Comments
Google history: When Was Google Founded and By Whom?
31.10.2024
0 Comments
Waterfalls: Sajikot Waterfall
05.12.2023
0 Comments
free software download websites for pc
21.09.2023
0 Comments
10 Latest PLC Technology Trends
21.10.2023
0 Comments
Magic Spoon Cereal Review
28.10.2023
0 Comments
Categories
AUTO
(23)
HEALTH and Food
(195)
TESTIMONIALS (References)
(0)
SPORTS
(12)
IT and AI
(70)
Accessories
(0)
News
(167)
Pet
(15)
Visiting Place News
(24)
Style and Fashion news
(25)
Geography News
(0)
Entertainment News
(0)
Random Posts
HEALTH and Food
Foods You Should Take to Boost Our Immune System
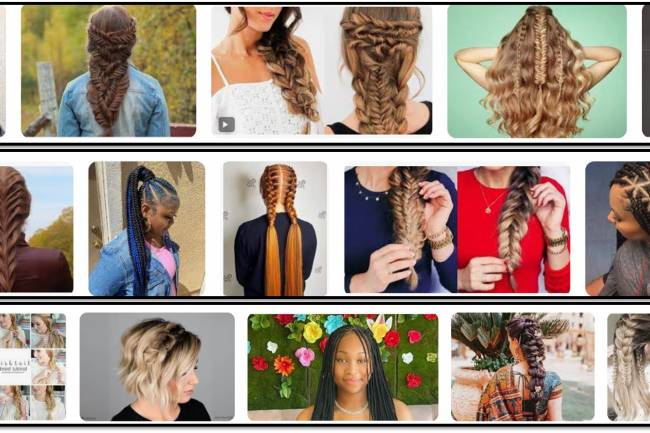
Style and Fashion news
Top 5 Fishtail Hairdos for Ponytails You Should Try
SPORTS
Boxing : Ryan Garcia bounced back, knocking out Oscar Duarte in the 8th...
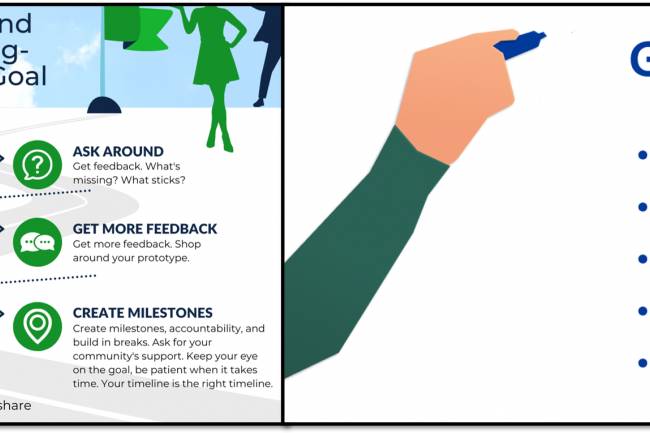
News
How To Achieve "Career Goals"
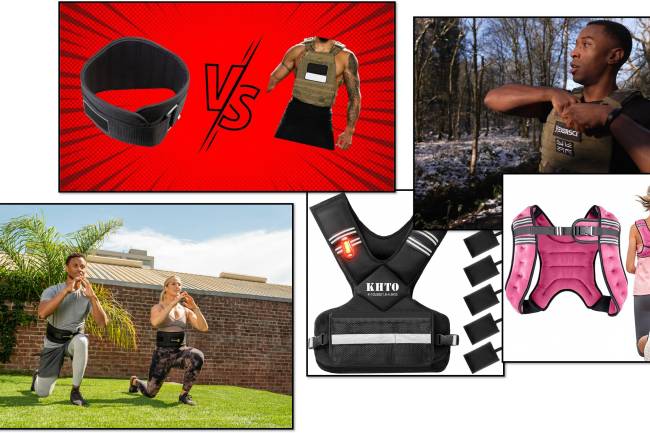
HEALTH and Food
Weighted Vests and belt for Women and Men Walking
Tags
Rotate Clockwise
Volcanic Ash
Rich in Magnesium
Rangers first baseman
Perspective shift
The Home Depot electrical supplies
Data normalization techniques
Minimal Waste Products
self-employed digital marketer
Roti Canai
Switzerland #LuganoSwitzerland
Blue
Avian intelligence
Footer color
Data Integration
Your browser does not support the canvas element.