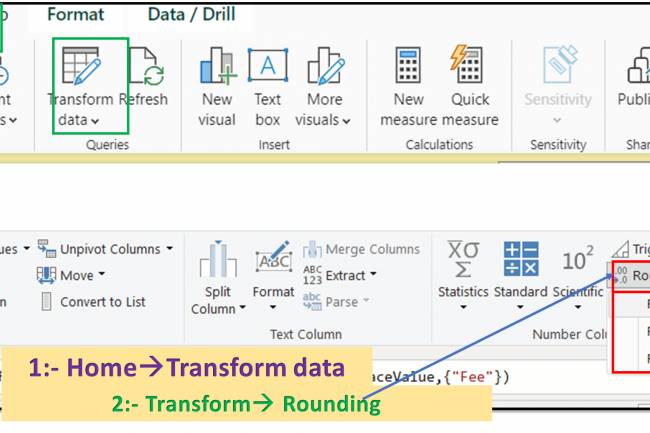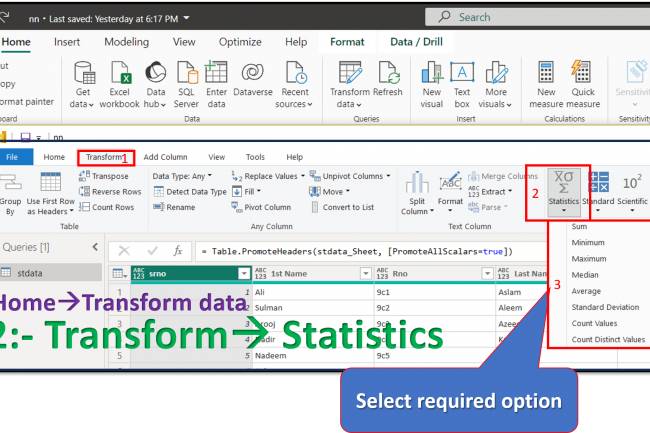
Filtering: Apply filter on visualization view in Power BI: Lik sorting and others: Lesson-6 P-4
Filters in Power BI: Unveiling data insights through focused exploration
Filters play an important role in data analysis within Power BI, allowing you to zoom in on specific subsets of data and gain deeper insights. Here is a comprehensive overview:
Types of filters:
- Report Level Filters: Apply to the entire report, affecting all visuals and pages. Great for setting global standards.
- Page-level filters: Limit data to a specific page, enabling analysis focused on multiple pages.
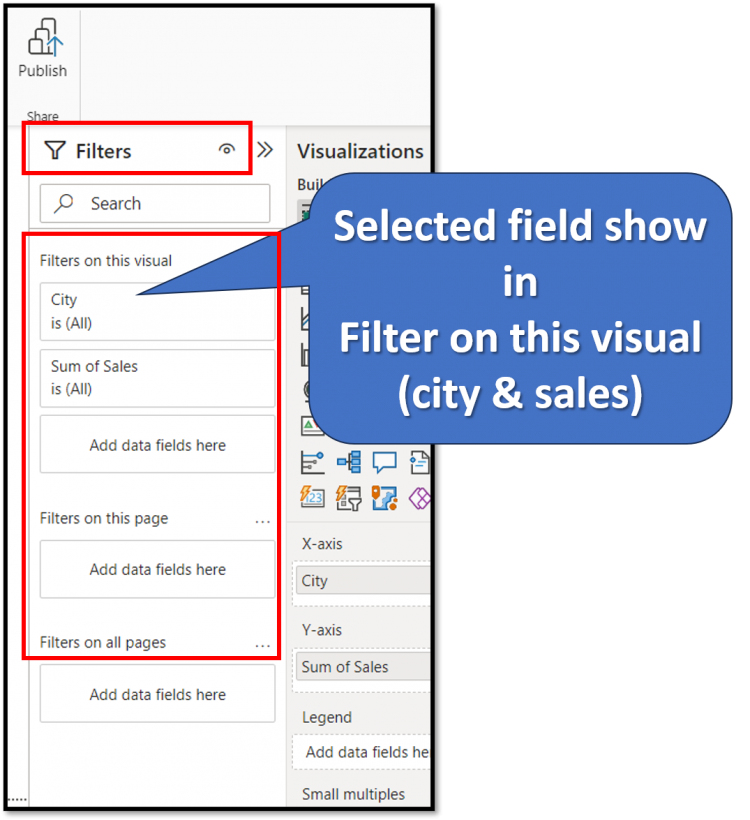
- Visual Level Filters: Target individual visuals, letting you explore different aspects of the same data independently.
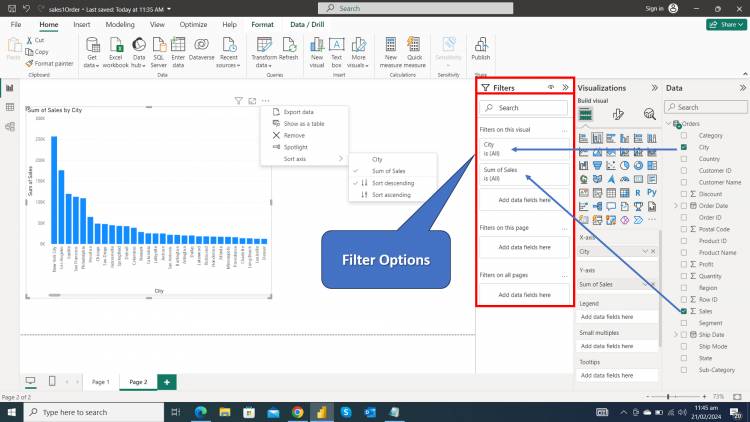
Apply filters:
- From the visual: Click the funnel icon within the visual to explore the filter options.
- From the Filter Pane: In Power BI Desktop, the Filter Pane (on the right) displays the current filters. Add, edit or remove filters here.
- Using Slicers: Slicers offer visual interaction for filtering data by clicking or dragging elements.
Key filter components:
- Field: The data column being filtered.
- Operator: Specifies the filtering condition (for example, equal to, greater than, in).
- Values: Specific criteria applied to the selected field (eg, specific product name, date range).
Advanced filtering techniques:
- Relative Date Filters: A filter based on a time frame related to the current date (eg, last week, year-to-date).
- Top N Filters: Focus on the top or bottom N values in the field.
- Wildcard filters: Use wildcards (* or ?) to match patterns in text values.
- Cross-Highlighting: Filter multiple visuals simultaneously to discover connections.
Advantages of using filters:
- Focused Analysis: Examine specific parts of your data for deeper understanding.
- Comparative Analysis: Compare different data subsets side by side.
- Data Clarity: Reduce visual clutter and highlight important information.
- Storytelling: Guide viewers through your data exploration with targeted filters.
Remember:
- Filter changes instantly update visuals, showing the effects of your selections.
- Experiment with different filter combinations to uncover hidden patterns and trends.
- Consider audience needs when designing reports and using filters for clarification.
By effectively using filters in Power BI, you can turn your data into a powerful tool to uncover meaningful insights and drive informed decision-making.
Lab Work of Filters:
1: Sorting Data
- Ascending order data view
- Select chart
- click on three dots ...
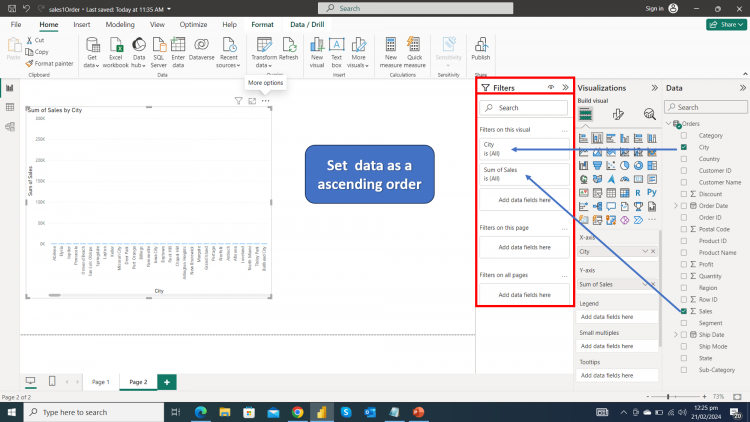
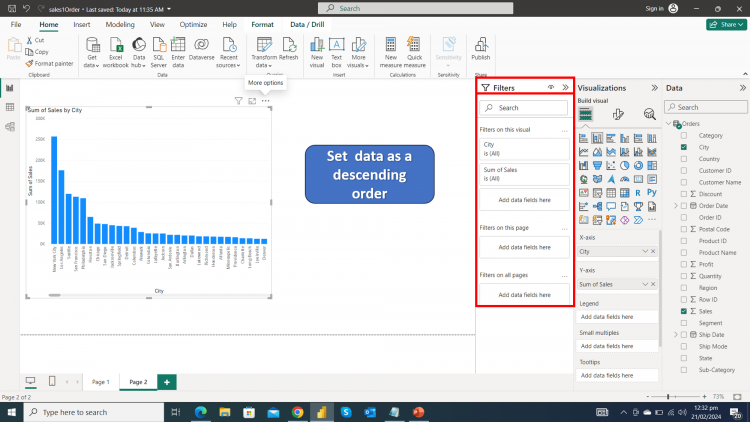
- Change it in Descending order
- Select required chart
- click on three dots ...
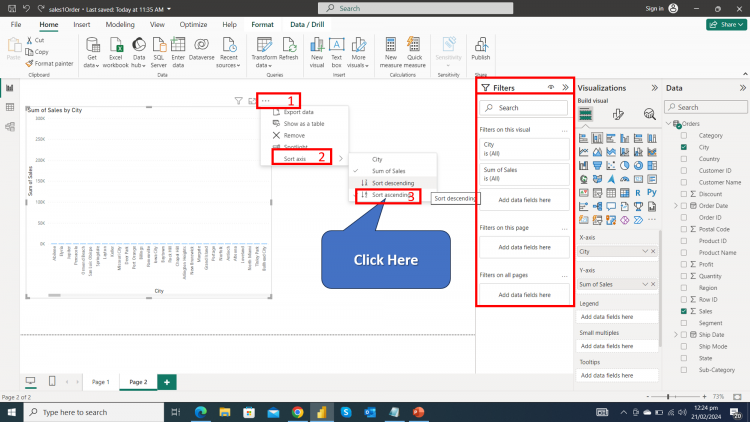
- Then you have
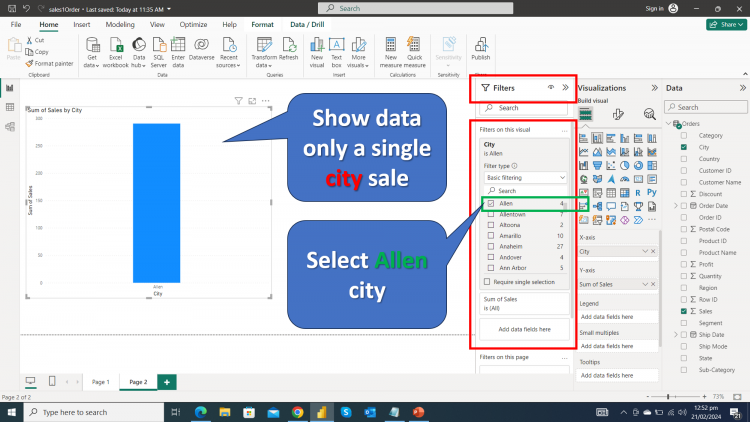
2:- Filters:
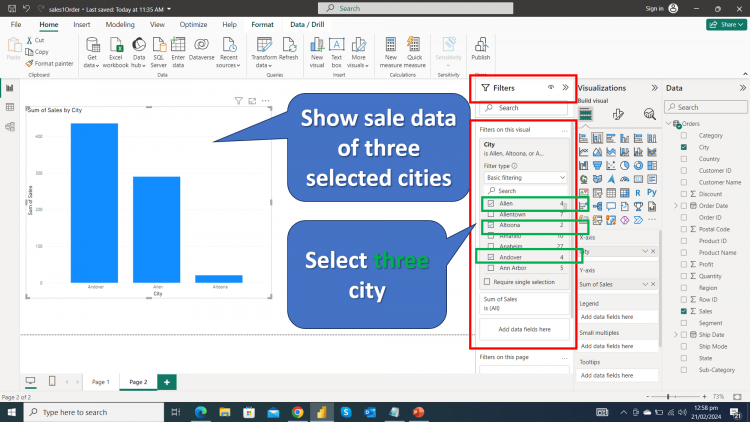
- Filter your data only single city's sale like "Allen" city
- select chart
- click on city field
- check required city like "Allen"
- Filter data more than one city like Allen, Altoona and Andover
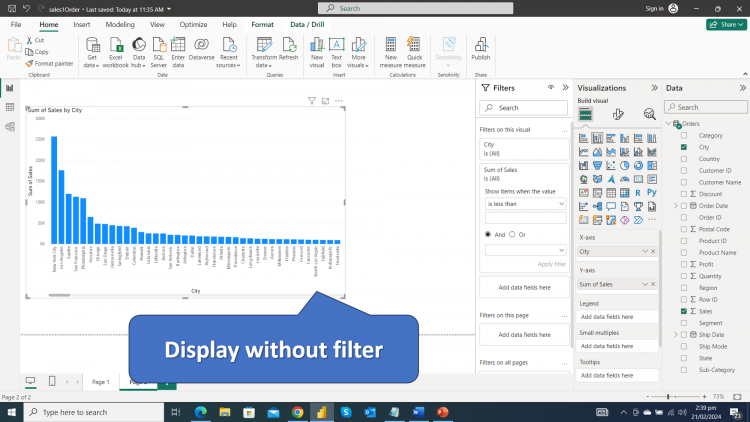
- Filter data according to sale
- select Sum of sales
- apply formula
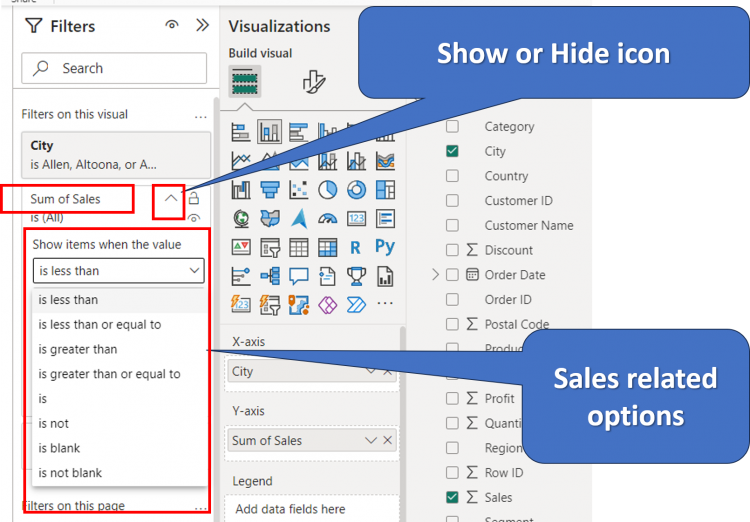
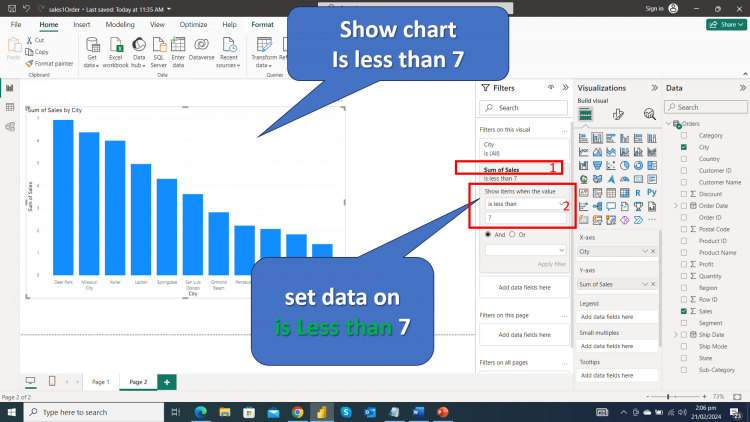
a:- is less than (formula)
- select sum of sales
- set filter
- click on apply filter
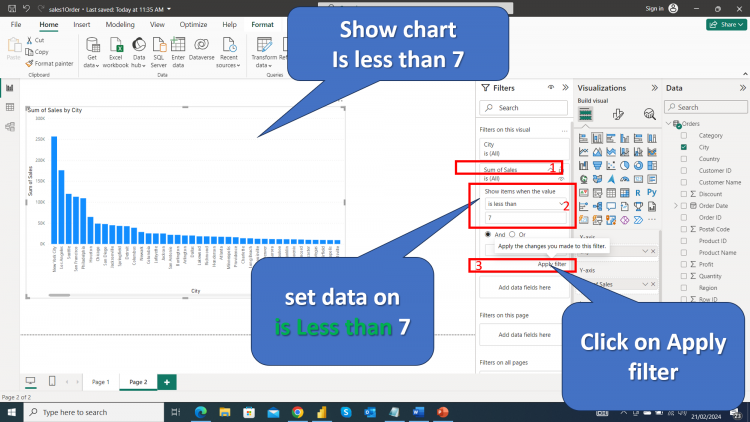
- then you have
- Remove Filter
- Mouse move on Sum of sales
- click on clear filter icon
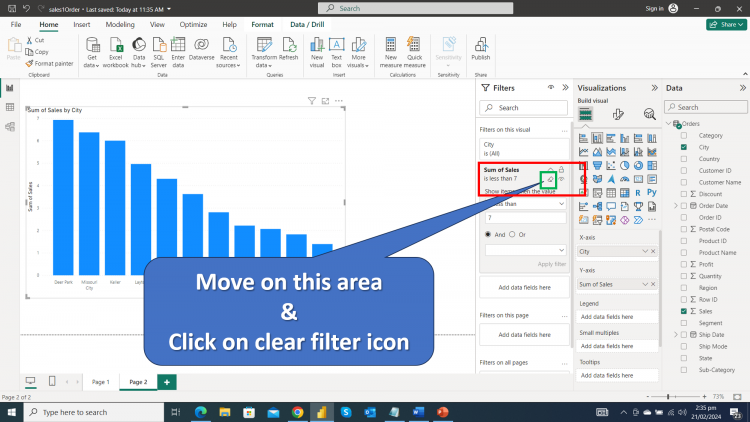
- Then you have
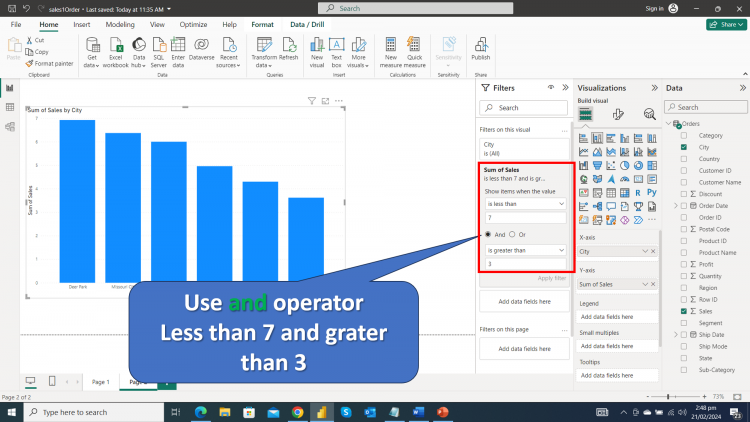
b:- is less than and is grater than
- Use and operator & apply the filter (formula)
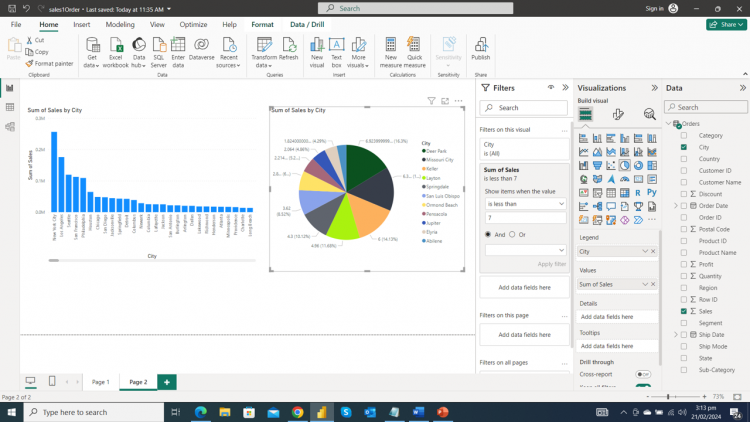
Note: So we can apply different filters on diffrent report chart data.
Example view:
Microsoft Power BI Table of Contents: Lessons Index
Text box in Home Ribbon in Power BI and select specific option from your Chart: Title of your Report. Lesson-6 P-3 (Previous)
Thanks