Transform Tab in Query Editor: the "Group By" option in Power BI: Lesson-7 P-6
TransformTab of Query Editor in Power BI: Group by option: Lesson-7 P-6
In the Power BI Query Editor, the "group by" operation allows you to group data based on one or more columns and aggregate on the grouped data.
How to use the "group by" feature:
- Select Columns: Start by selecting the column you want to group. You can select multiple columns if needed.
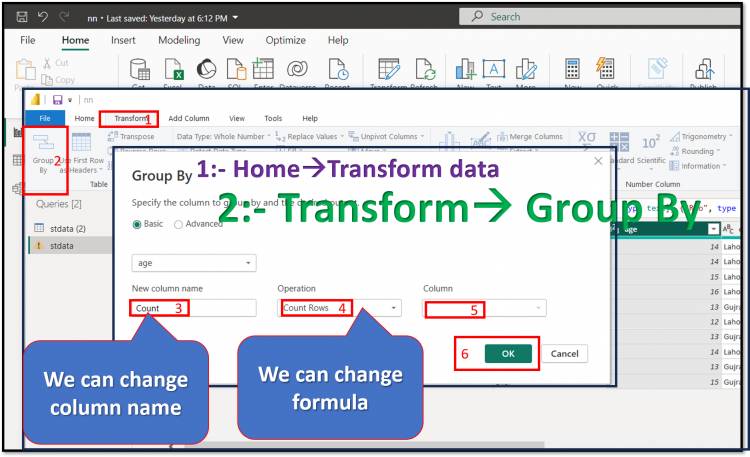
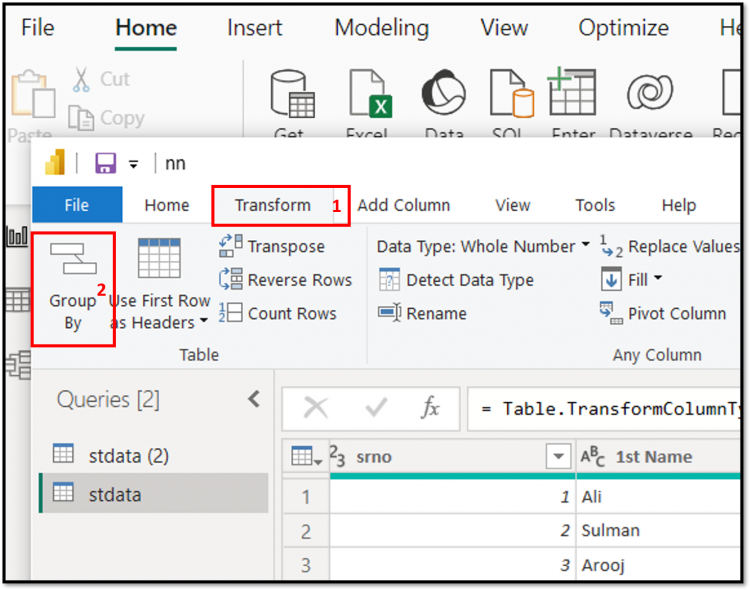
- Go to the Transform tab: Once you have selected the desired column, go to the "Transform" tab in the Query Editor ribbon at the top.
- Click on “Group By”: In the “Transform” tab, you will find the “Group By” option. Click on it to start the grouping process.
Sort the group by settings:
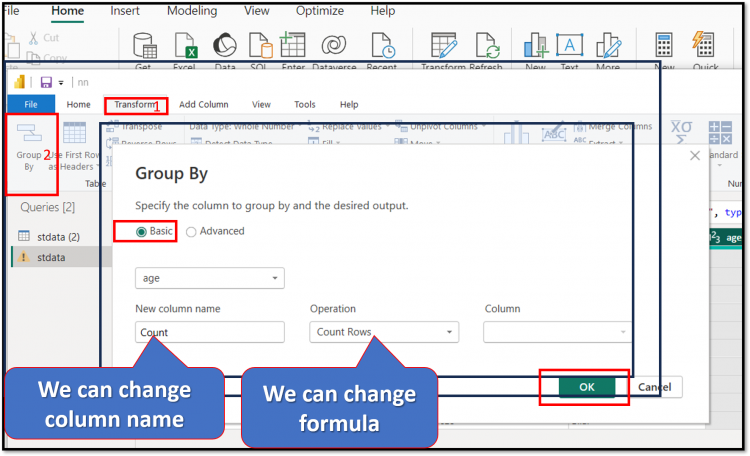
- Group by: Select the column by which you want to group the data. You can select one or more columns here.
- New Column Name: Specify a name for the new column that will contain the grouped data.
- Aggregations: Specify the aggregations you want to perform on each group. You can choose from a variety of built-in aggregation functions such as Sum, Average, Count, Min, Max, etc. Additionally, you can create custom aggregation functions using M code if needed.
- Click OK: Once you have configured the group through the settings, click "OK" to apply the grouping operation.
- Review and Edit: Review grouped data in the Query Editor window. You can further edit or refine the grouped data as needed.
Load or close and apply: Finally, once you're satisfied with the grouped data, you can load it into a Power BI data model or close and apply changes to an existing data source.
The "group by" operation is useful for summarizing data and performing aggregate calculations at different levels of granularity in your dataset.
Lab Work:
1:- Group by city
Load required data table:
- Home -> Get data -> Excel Workbook
open query editor (transform data)
- Home -> Transform data -> Transform data
- 1st of all select required colum for Group by (we select city column)
Group by:
- Transform -> Group by
after click on Group by
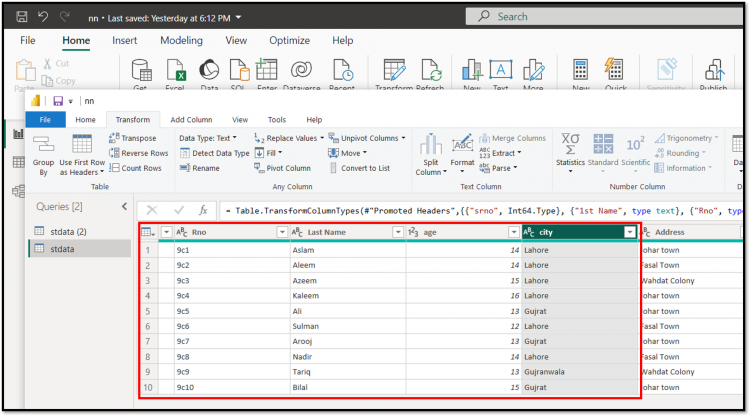
Simple table view
Click on OK button with default setting
- then you have Group by according to city column
- Group by city
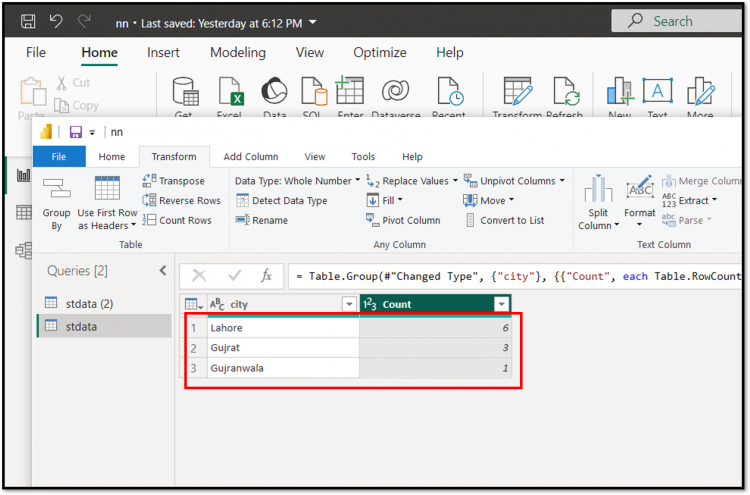
Description:
we have total 10 records in my table stdata after "group by" according to city column. It is telling us record numbers of different cities like Lahore have 6 students, Gujrat have 3 students and Gujranwala have only 1 student so the total is 10 students.
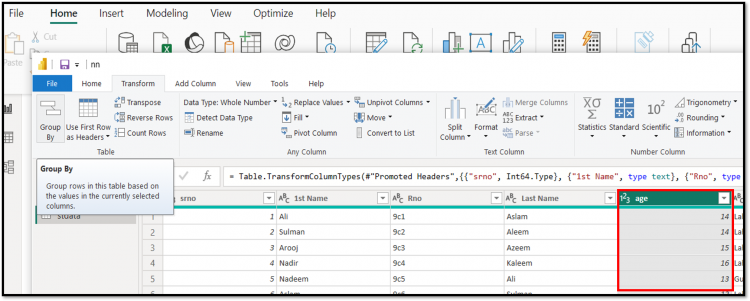
2:- Group by age
- Select age coloumn
- Click on Group By option(icon)
- Transform -> Group BY
After click on Group By
- Then click on OK button with default setting
then you have
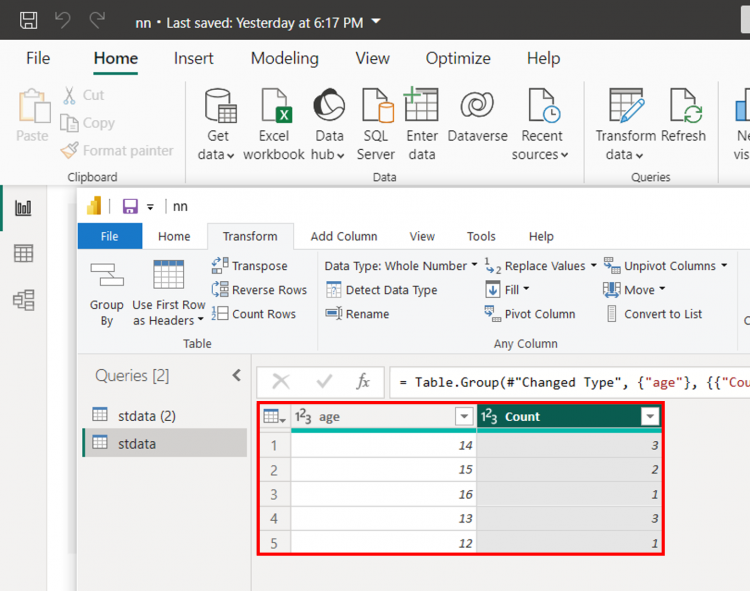
Describe:
We have 10 records
- age of 14 are 3
- age of 15 are 2
- age of 16 is 1
- age of 13 are 3
- age of 12 is 1
- total =10
3:- Group by fee
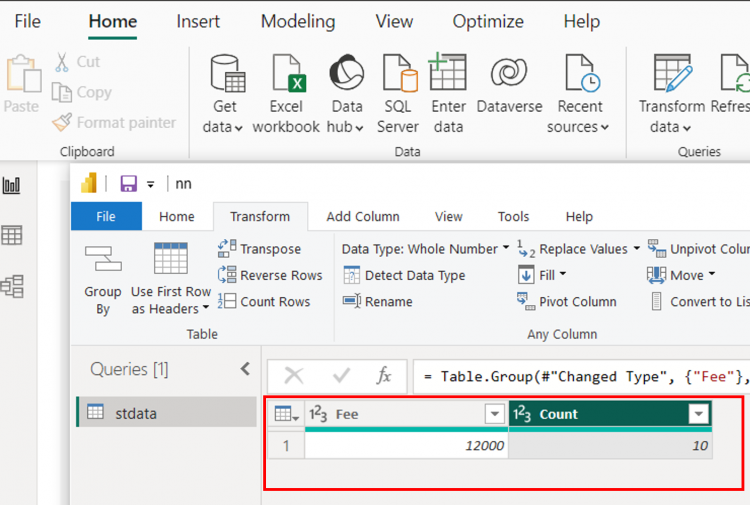
Note: This means (according to the approach above) the fee is the same for all students.
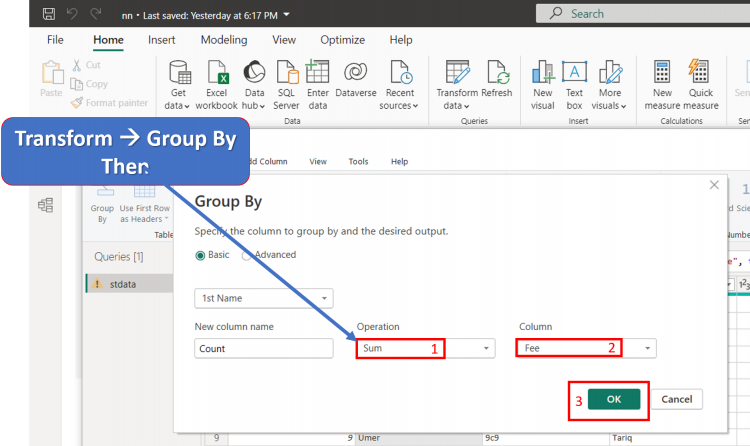
4:- Group by fee with opration(formula) Sum and Column fee
- select sum from Opration menu
- select fee from Column menu (fee is same for all)
Then you have final view
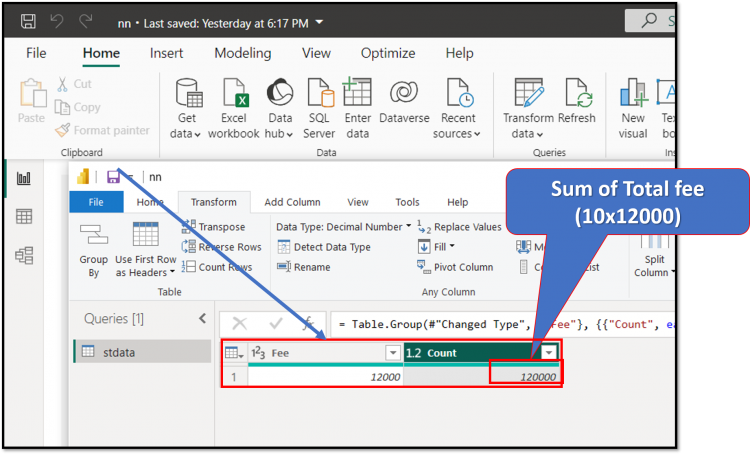
- 10 student and 12000 fee of every one
- so total is (10x12000)
- Total= 120000
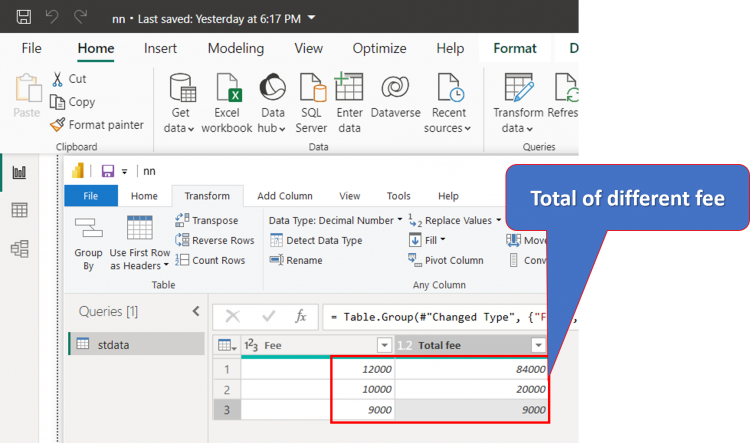
4:- Group by fee with opration(formula) Sum and Column fee
Now the fee is diffrent not same
- select sum from Opration menu
- select fee from Column menu (now the fee is diffrent for each students)
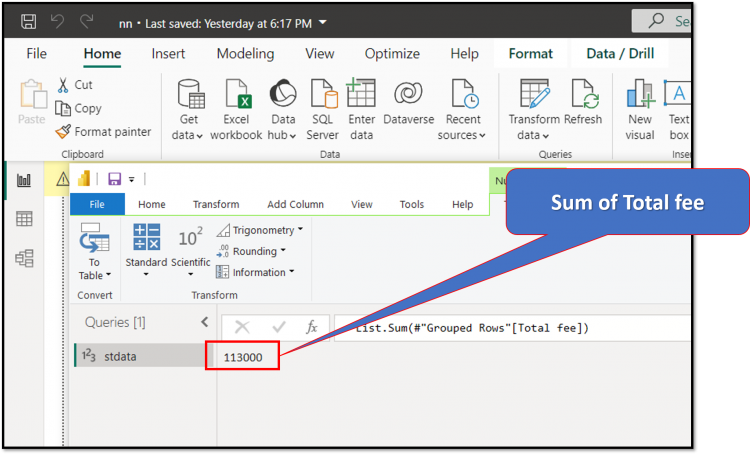
Sum of all values: (if you want to see total of all values) then
- Select Required column of table
- Transform -> Statistics -> Sum
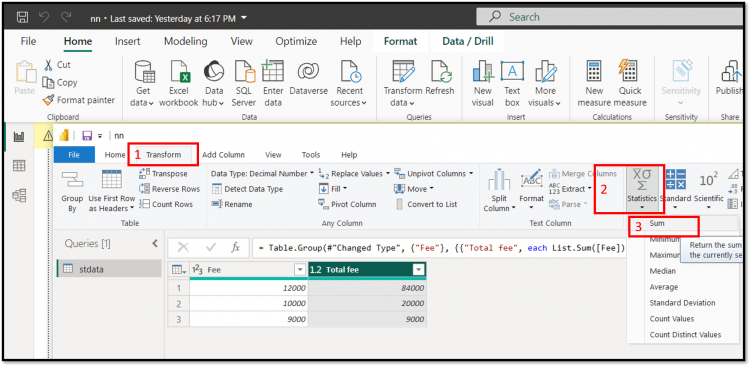
Then you have final view
So you can create groups in different ways according to your need.
Microsoft Power BI Table of Contents: Lessons Index
Thanks