Toggle navigation
Home
Contact
Login
Register
Home
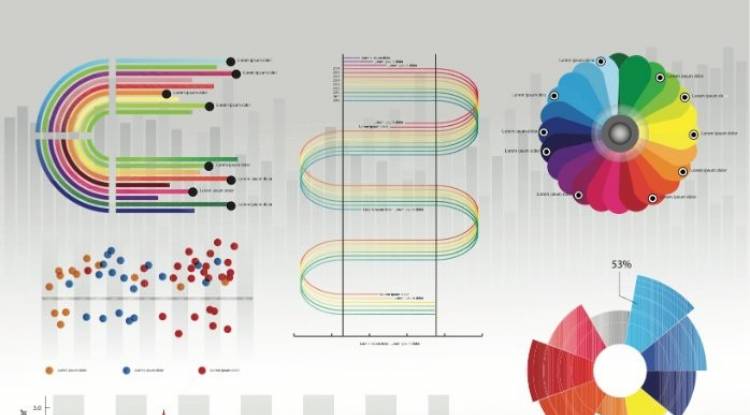
Tag : Box Plots
Tag : Box Plots
Popular Posts
Khewra Mine Salt
28.12.2023
0 Comments
free software download websites for pc
21.09.2023
0 Comments
10 Latest PLC Technology Trends
21.10.2023
0 Comments
Google history: When Was Google Founded and By Whom?
31.10.2024
0 Comments
Waterfalls: Sajikot Waterfall
05.12.2023
0 Comments
Magic Spoon Cereal Review
28.10.2023
0 Comments
Categories
AUTO
(23)
HEALTH and Food
(195)
TESTIMONIALS (References)
(0)
SPORTS
(12)
IT and AI
(70)
Accessories
(0)
News
(167)
Pet
(15)
Visiting Place News
(24)
Style and Fashion news
(25)
Geography News
(0)
Entertainment News
(0)
Random Posts
News
The challenge of sharing: Being parents: Being siblings
News
ICYMI: "In Case You Missed It." and example of ICMI: March and April...
HEALTH and Food
Virtual Hangouts (computer generated lairs): Benefits and other information
News
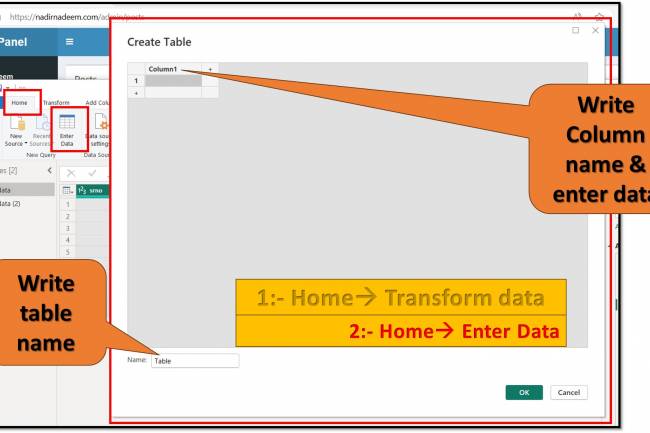
Home Tab in Query Editor: "Enter Data" option in home tab of query editor...
News
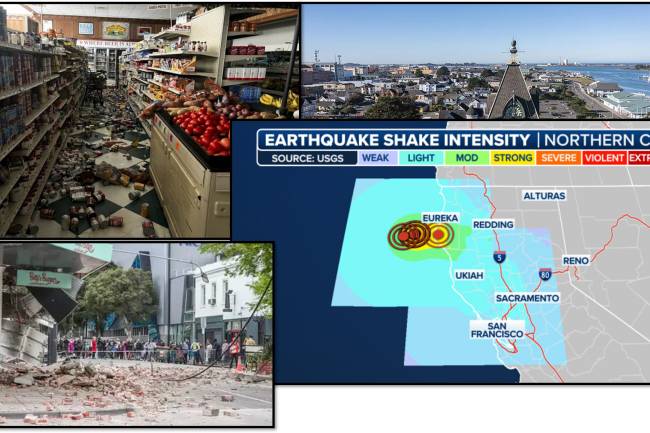
California is shook by 7.0-magnitude earthquake near Eureka
Tags
Dance Dedication
superfood benefits
Data profiling
Evening gown
sculpted leather seats
Celebrity haircare tips
Sustainable Food Innovations
Dysmenorrhea
Best camera with microphone input
Vitamins
species diversity
Vitamins
#HeadbandBraidedPonytail
what channel is the texas rangers game on
Global health plans
Your browser does not support the canvas element.