Toggle navigation
Home
Contact
Login
Register
Home
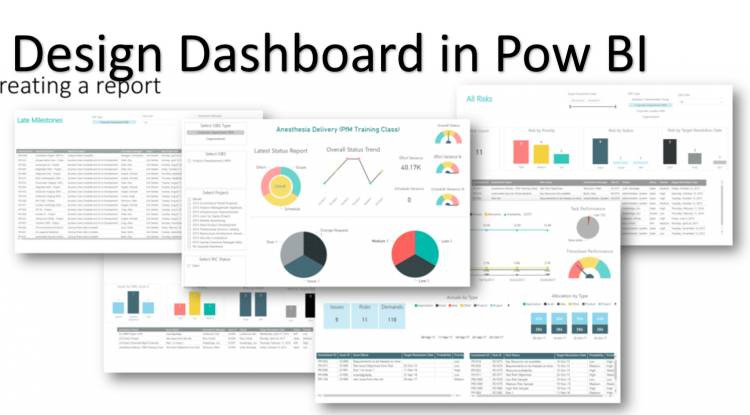
Tag : Dashboard interactivity
Tag : Dashboard interactivity
Popular Posts
Khewra Mine Salt
28.12.2023
0 Comments
Google history: When Was Google Founded and By Whom?
31.10.2024
0 Comments
Waterfalls: Sajikot Waterfall
05.12.2023
0 Comments
free software download websites for pc
21.09.2023
0 Comments
10 Latest PLC Technology Trends
21.10.2023
0 Comments
Magic Spoon Cereal Review
28.10.2023
0 Comments
Categories
AUTO
(23)
HEALTH and Food
(195)
TESTIMONIALS (References)
(0)
SPORTS
(12)
IT and AI
(70)
Accessories
(0)
News
(167)
Pet
(15)
Visiting Place News
(24)
Style and Fashion news
(25)
Geography News
(0)
Entertainment News
(0)
Random Posts
HEALTH and Food
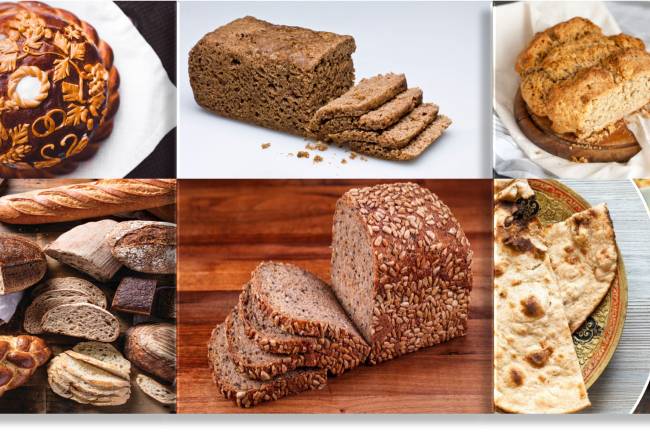
The 50 Most Delicious Breads in the World
IT and AI
Multi-Stakeholder Collaboration on AI info
HEALTH and Food
Turtle & Turtle Recipes.
Pet
Green-Cheeked Conure parrot: popular pet
Style and Fashion news
The Money for Quality White Dresses Trend and white Heel
Tags
The Home Depot insulation boards
Digestion support
video conferencing
NewYearCheers
Music Discovery
Parameter validation
Tea infuser
performance
#SwitzerlandTravel
Word Options
Epsom salt for sleep
shrimp chow mein
nylon
Geological Wonders
Richter scale
Your browser does not support the canvas element.