Toggle navigation
Home
Contact
Login
Register
Home
Tag : Dashboard performance
Tag : Dashboard performance
Popular Posts
Khewra Mine Salt
28.12.2023
0 Comments
Waterfalls: Sajikot Waterfall
05.12.2023
0 Comments
Google history: When Was Google Founded and By Whom?
31.10.2024
0 Comments
free software download websites for pc
21.09.2023
0 Comments
10 Latest PLC Technology Trends
21.10.2023
0 Comments
Magic Spoon Cereal Review
28.10.2023
0 Comments
Categories
AUTO
(23)
HEALTH and Food
(195)
TESTIMONIALS (References)
(0)
SPORTS
(12)
IT and AI
(70)
Accessories
(0)
News
(167)
Pet
(15)
Visiting Place News
(24)
Style and Fashion news
(25)
Geography News
(0)
Entertainment News
(0)
Random Posts
Style and Fashion news
A “6-Day Star Blanket” that uses a double crochet stitch: Step by STep
News
Eid-ul- Adha in 2025 and History: Eid -e-Qurban
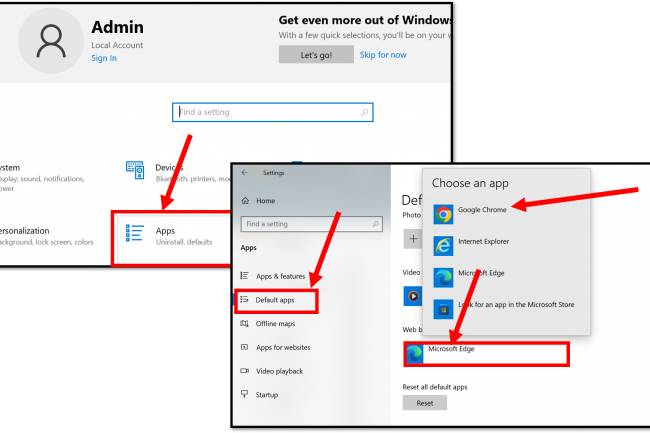
IT and AI
Set a browser as your default:
HEALTH and Food
Egg White Good for You Everyday
HEALTH and Food
Magnesium Sulfate for Human Benefits and Side Effects
Tags
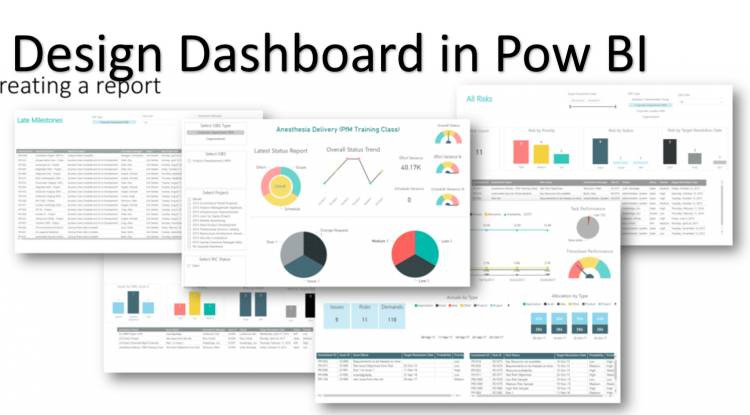
Power BI data lake implementation
martial law enforcement
Small parrots
Travel Destinations
scottish fold
NFL scores and conference battles
Transatlantic relations
security
Culinary Uses
Lentil soup
AI Transparency
digital marketing ROI tracking
Nostalgia
Headache reduction
NFL scores and divisional matchups
Your browser does not support the canvas element.