Toggle navigation
Home
Contact
Login
Register
Home
Tag : Interactive dashboards
Tag : Interactive dashboards
Popular Posts
Khewra Mine Salt
28.12.2023
0 Comments
Waterfalls: Sajikot Waterfall
05.12.2023
0 Comments
Google history: When Was Google Founded and By Whom?
31.10.2024
0 Comments
free software download websites for pc
21.09.2023
0 Comments
10 Latest PLC Technology Trends
21.10.2023
0 Comments
Magic Spoon Cereal Review
28.10.2023
0 Comments
Categories
AUTO
(23)
HEALTH and Food
(195)
TESTIMONIALS (References)
(0)
SPORTS
(12)
IT and AI
(70)
Accessories
(0)
News
(167)
Pet
(15)
Visiting Place News
(24)
Style and Fashion news
(25)
Geography News
(0)
Entertainment News
(0)
Random Posts
HEALTH and Food
Virtual Hangouts (computer generated lairs): Benefits and other information
Visiting Place News
Crossing The Rainbow Bridge
SPORTS
Boxing : Ryan Garcia bounced back, knocking out Oscar Duarte in the 8th...
HEALTH and Food
Detailed information about "Mindful Eating": Benefits and Principles
Visiting Place News
Brooklyn Bridge a Detail review with Nearby Attractions
Tags
WindowsThreats
Zingiber officinale
foot inserts
Alan Hamel Suzanne Somers Family Life
2025
Food Security
mindful movement
reliable metro systems
lorikeet care
AI for everyone
automatic
Economic importance
Emotional balance
high-quality digital marketing freelancer
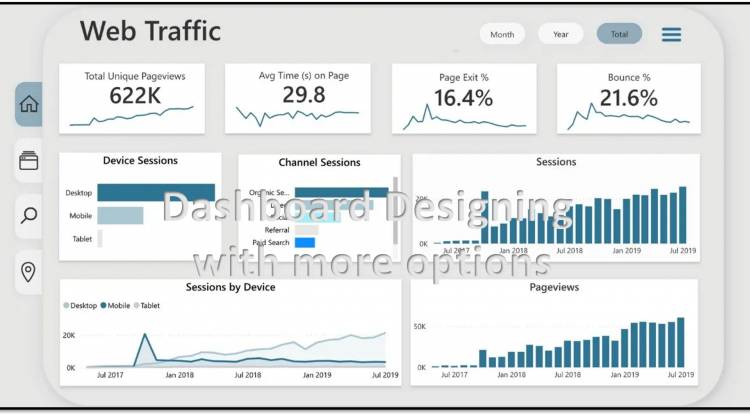
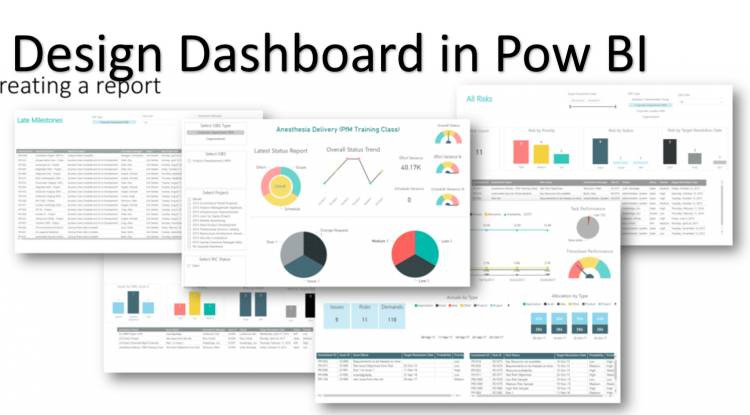
Dashboard design
Your browser does not support the canvas element.