Toggle navigation
Home
Contact
Login
Register
Home
Tag : Streamgraphs
Tag : Streamgraphs
Popular Posts
Khewra Mine Salt
28.12.2023
0 Comments
Waterfalls: Sajikot Waterfall
05.12.2023
0 Comments
Google history: When Was Google Founded and By Whom?
31.10.2024
0 Comments
free software download websites for pc
21.09.2023
0 Comments
10 Latest PLC Technology Trends
21.10.2023
0 Comments
Magic Spoon Cereal Review
28.10.2023
0 Comments
Categories
AUTO
(23)
HEALTH and Food
(195)
TESTIMONIALS (References)
(0)
SPORTS
(12)
IT and AI
(70)
Accessories
(0)
News
(167)
Pet
(15)
Visiting Place News
(24)
Style and Fashion news
(25)
Geography News
(0)
Entertainment News
(0)
Random Posts
HEALTH and Food
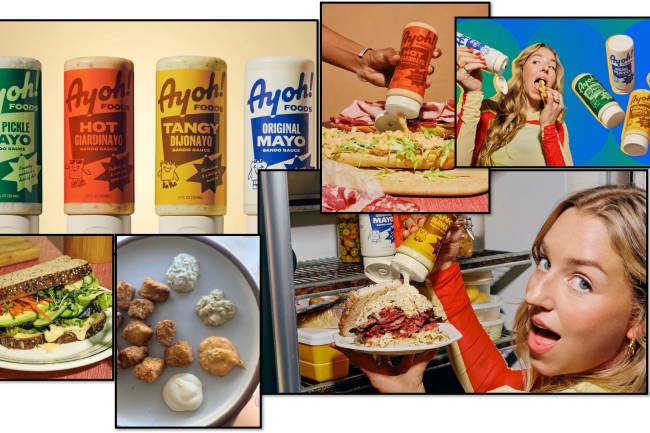
Ayoh Mayoh (redefines mayonnaise)
News
Top 20 Greatest Darts Players of All Time
HEALTH and Food
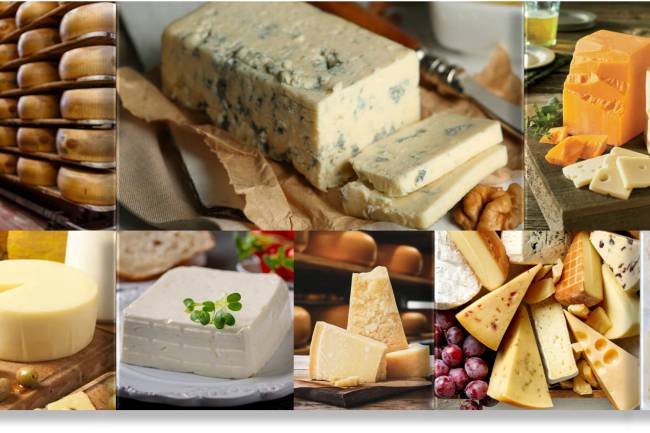
The World's Tastiest Cheeses in Detail
HEALTH and Food
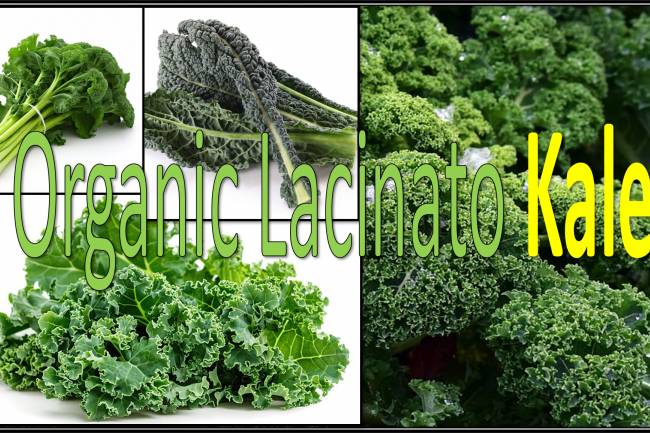
Organic Lacinato Kale
News
Earthquake in Myanmar and Thailand: On Friday, March 28, 2025
Tags
Power BI Desktop
AI in education
NFL scores and all-time greats
Data Analysis Tools
Employer-sponsored plans
white pepper flavor
Cockatiel pearl
vitamin D
skincare ingredients
Award-winning actress
RPA in User Account Management
Honda Accord 2025 Price
Pixel 8 Camera Tricks
Automation in Government
Plant-Based Recipes
Your browser does not support the canvas element.