Tag : Visual hierarchy
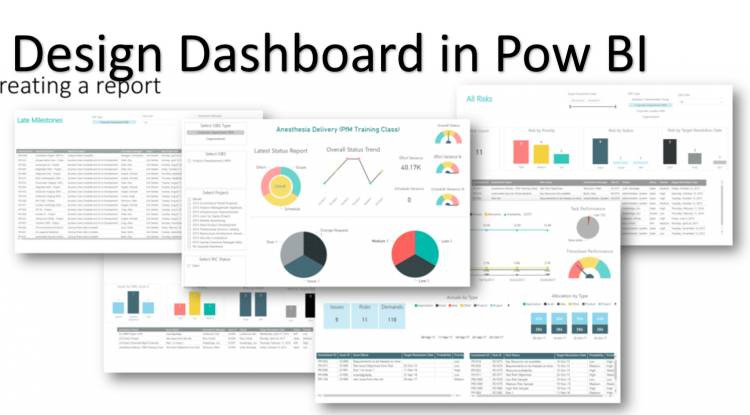
Creating a dashboard in Power BI involves several key steps and considerations. First, you need to connect your data sources to Power BI and import the relevant datasets. Then, you can start designing your dashboard by adding visualizations such as charts, graphs, and tables to convey insights effectively. Power BI offers a wide range of visualization options and customization features to tailor your dashboard to your specific needs.
Popular Posts
-


Khewra Mine Salt
28.12.2023 0 Comments -


Waterfalls: Sajikot Waterfall
05.12.2023 0 Comments -


Google history: When Was Google Founded and By Whom?
31.10.2024 0 Comments -


free software download websites for pc
21.09.2023 0 Comments -


10 Latest PLC Technology Trends
21.10.2023 0 Comments -


Magic Spoon Cereal Review
28.10.2023 0 Comments
Categories
- AUTO(23)
- HEALTH and Food(195)
- TESTIMONIALS (References)(0)
- SPORTS (12)
- IT and AI(70)
- Accessories(0)
- News(167)
- Pet(15)
- Visiting Place News(24)
- Style and Fashion news (25)
- Geography News(0)
- Entertainment News(0)
Random Posts
Tags
- Hidden Paradise
- Hybrid Solar Eclipse
- home spa bath
- Eclipse Green Innovations
- AI impact
- Blood Sugar Control
- crocs cowboy boots pointed toe
- Notre Dame Fighting Irish
- Moringa hair growth
- Musical Discovery
- Eco-friendly Travel
- Geological Monitoring and Safety Measures.
- Boston Celtics coaching innovations
- gardening calendar sunflowers
- sea creature mimicry


