Toggle navigation
Home
Contact
Login
Register
Home
Tag : Data filtering
Tag : Data filtering
1
2
Popular Posts
Gus's Fried Chicken
27.12.2023
0 Comments
Khewra Mine Salt
28.12.2023
0 Comments
Magic Spoon Cereal Review
28.10.2023
0 Comments
Egyptian Perfumery: Perfume History in Egypt
03.04.2024
0 Comments
Octopus Recipes & Dishes
06.01.2024
0 Comments
Perfume History: Perfume: Cologne: Scent: Fragrance
02.04.2024
0 Comments
Categories
AUTO
(11)
HEALTH
(22)
TECH
(10)
SCIENCE
(0)
SOCIAL MEDIA
(0)
PRESS RELEASES
(0)
TESTIMONIALS (References)
(6)
BIO
(1)
SPORTS
(9)
EARNING ONLINE
(0)
ARCHITECTURE
(1)
IT
(47)
Accessories
(3)
News
(14)
Pet
(13)
Programming
(5)
Shopping
(11)
Visiting Place
(13)
Foods & Candies
(7)
Style and Fashion
(3)
Geography
(1)
Personalities
(2)
Random Posts
News
Jennifer Aniston movies and tv shows and salad
HEALTH
Moringa oil and Moringa tree Powder benefits: Moringa Power
Accessories
Fun Feather Fur: Your destination for outdoor adventures
Foods & Candies
Top 10 cuisines in the word rendering to Taste Atlas
IT
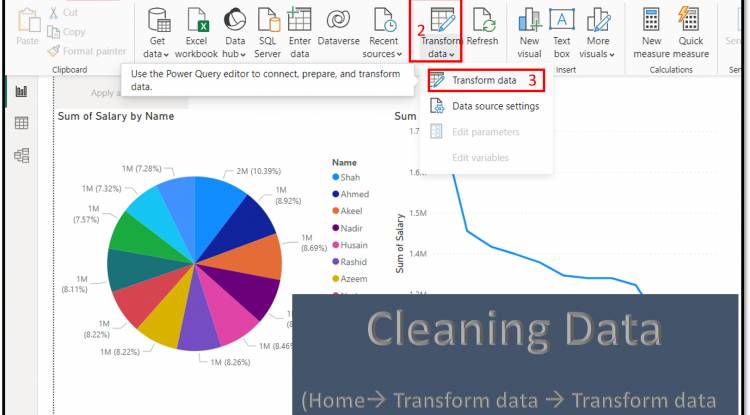
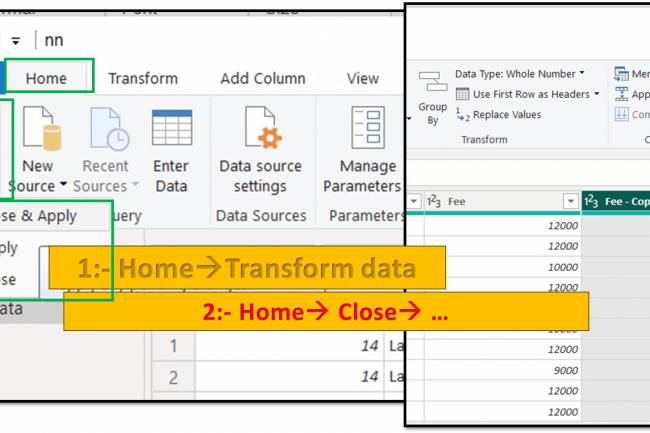
Home Tab in Query Editor: Close, close & apply, apply options in home...
Tags
Eco-friendly practices
Economic growth
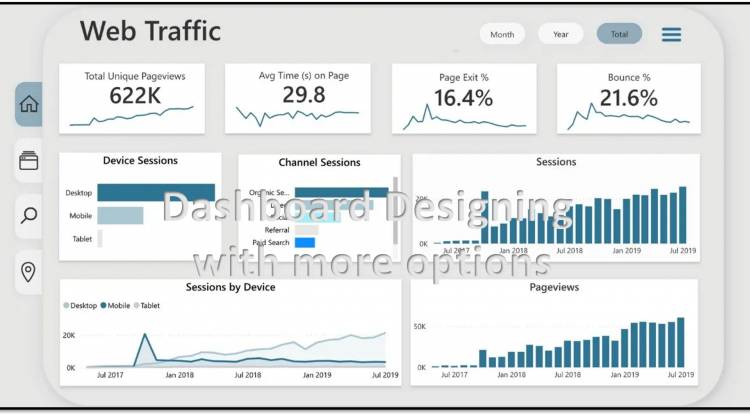
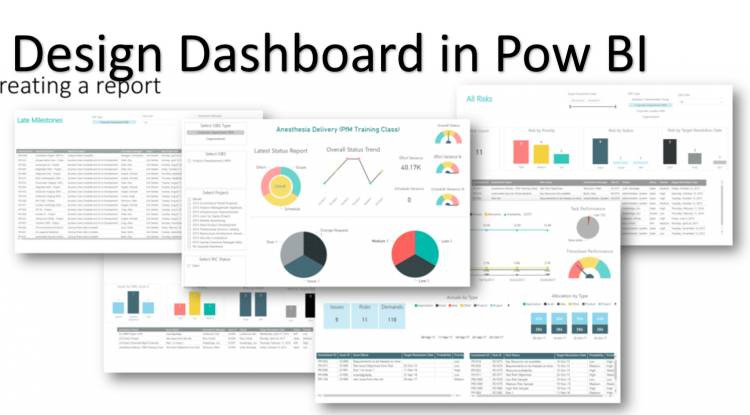
Dashboard Design
Fred Aldous
Natural Sweetness
Mining Industry
clean metro systems
Blue Lagoon Iceland Harmony Steam Room
T-Mobile Near Me
RPA in Manufacturing
Data Presentation
The Home Depot faucets
Level up your look
Breakfast Innovation
The John Rylands Library
Your browser does not support the canvas element.