Toggle navigation
Home
Contact
Login
Register
Home
Tag : Data Representation
Tag : Data Representation
Popular Posts
Khewra Mine Salt
28.12.2023
0 Comments
Google history: When Was Google Founded and By Whom?
31.10.2024
0 Comments
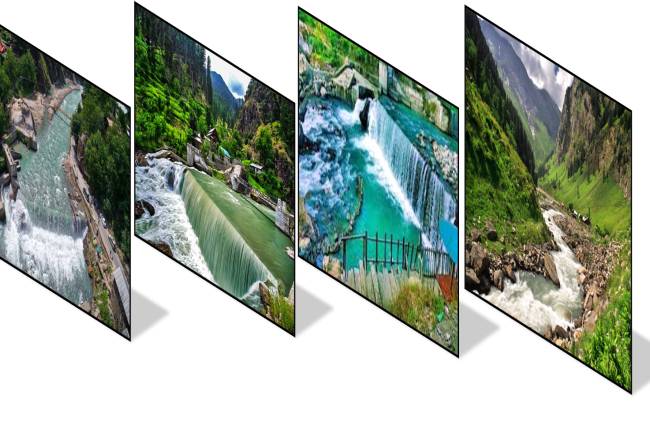
Waterfalls: Sajikot Waterfall
05.12.2023
0 Comments
free software download websites for pc
21.09.2023
0 Comments
10 Latest PLC Technology Trends
21.10.2023
0 Comments
Magic Spoon Cereal Review
28.10.2023
0 Comments
Categories
AUTO
(23)
HEALTH and Food
(195)
TESTIMONIALS (References)
(0)
SPORTS
(12)
IT and AI
(70)
Accessories
(0)
News
(167)
Pet
(15)
Visiting Place News
(24)
Style and Fashion news
(25)
Geography News
(0)
Entertainment News
(0)
Random Posts
News
Edge Computing: Exploring the Potential of Edge Computing
Pet
Green-Cheeked Conure parrot: popular pet
SPORTS
2025 Sugar Bowl - American football game: Top 10 Players
Visiting Place News
Waterfalls : Kutton Waterfall : A Essential Visit Traveler Spot in Neelam...
News
Lunar Eclipse Blood Moon
Tags
Cost-Effective
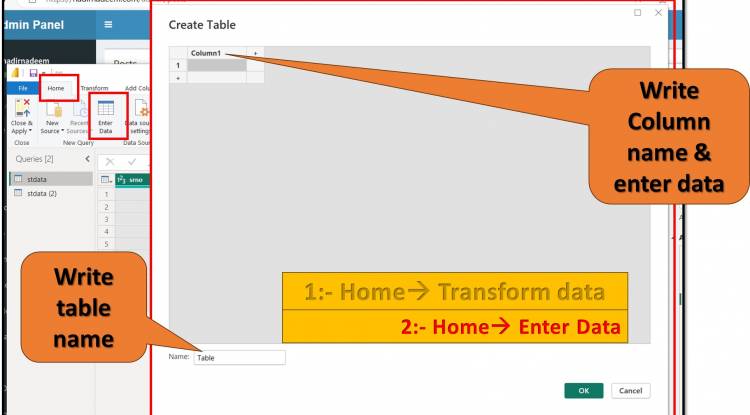
Pivot Column
Blue-and-Gold Macaw
skin oil
Rangers baseball
Longevity
Nick Snyder
Health
Impact in Myanmar
Christian
PLC in CNC Broaching
Filipino Food
Antimicrobial
such as SEO for blog posts
Mardi Gras colors
Your browser does not support the canvas element.