Toggle navigation
Home
Contact
Login
Register
Home
Tag : Data warehousing
Tag : Data warehousing
Popular Posts
Khewra Mine Salt
28.12.2023
0 Comments
Google history: When Was Google Founded and By Whom?
31.10.2024
0 Comments
Waterfalls: Sajikot Waterfall
05.12.2023
0 Comments
free software download websites for pc
21.09.2023
0 Comments
10 Latest PLC Technology Trends
21.10.2023
0 Comments
Magic Spoon Cereal Review
28.10.2023
0 Comments
Categories
AUTO
(23)
HEALTH and Food
(195)
TESTIMONIALS (References)
(0)
SPORTS
(12)
IT and AI
(70)
Accessories
(0)
News
(167)
Pet
(15)
Visiting Place News
(24)
Style and Fashion news
(25)
Geography News
(0)
Entertainment News
(0)
Random Posts
IT and AI
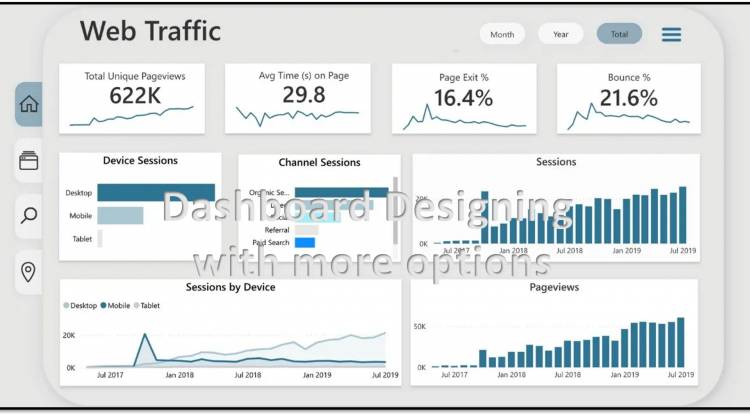
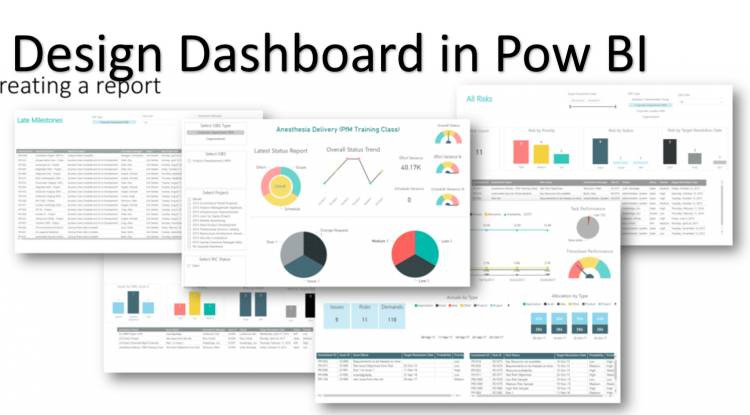
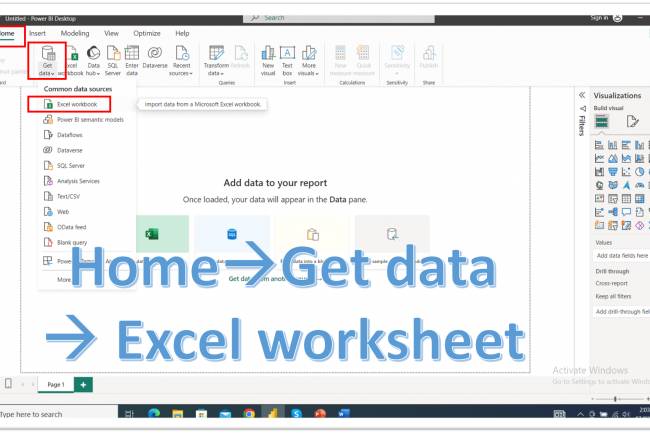
Microsoft Power BI: Get Data option in HOME Ribbon: Loding Data: Excel...
News
Blind Boxes
HEALTH and Food
10 Best Korean Food Recipes and Recipes Making
Visiting Place News
Waterfalls : Neela Sandh Waterfall
News
AI Federated Learning
Tags
Dress to impress without the stress
Taste
Burger
busiest train networks
Cost Plus World Market Dining Chairs
NFL scores and trends
SEO salary
cozy minimalism
Miscarriage
repotting guide
Essential oils
Enhanced image signal processor
kids' emotions
future of AI
Rainbow Bridge voyage
Your browser does not support the canvas element.