Tag : Choropleth Maps
Data visualization: Easier More Comfortable: Data visualization is a journey, not a destination
05.02.2024
0 Comments
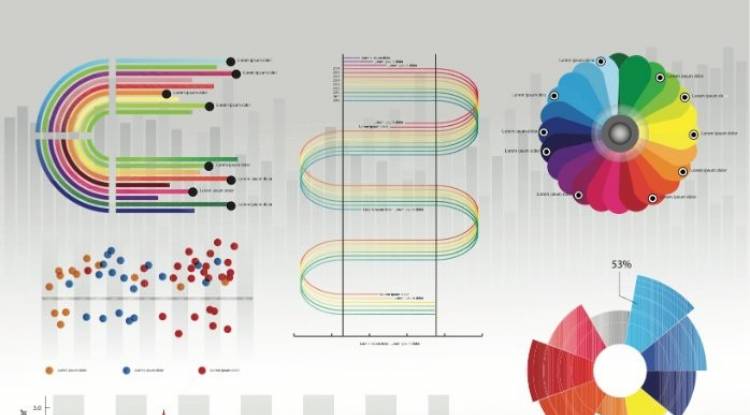
Data visualization: A graphical illustration of information and data. It allows exploration, analysis and communication of complex datasets through visual elements such as charts, graphs and maps. By transforming data into visual forms, patterns, trends, and insights become more accessible and understandable to users, helping decision-making processes in fields as diverse as business, science, and education. Effective data visualization enhances understanding, facilitates storytelling, and enables the discovery of actionable insights from large and complex data sets.
Popular Posts
-


Khewra Mine Salt
28.12.2023 0 Comments -


Google history: When Was Google Founded and By Whom?
31.10.2024 0 Comments -


Waterfalls: Sajikot Waterfall
05.12.2023 0 Comments -


free software download websites for pc
21.09.2023 0 Comments -


10 Latest PLC Technology Trends
21.10.2023 0 Comments -


Magic Spoon Cereal Review
28.10.2023 0 Comments
Categories
- AUTO(23)
- HEALTH and Food(195)
- TESTIMONIALS (References)(0)
- SPORTS (12)
- IT and AI(70)
- Accessories(0)
- News(167)
- Pet(15)
- Visiting Place News(24)
- Style and Fashion news (25)
- Geography News(0)
- Entertainment News(0)


