Toggle navigation
Home
Contact
Login
Register
Home
Tag : Dashboard aesthetics
Tag : Dashboard aesthetics
Popular Posts
Khewra Mine Salt
28.12.2023
0 Comments
Waterfalls: Sajikot Waterfall
05.12.2023
0 Comments
Google history: When Was Google Founded and By Whom?
31.10.2024
0 Comments
free software download websites for pc
21.09.2023
0 Comments
10 Latest PLC Technology Trends
21.10.2023
0 Comments
Magic Spoon Cereal Review
28.10.2023
0 Comments
Categories
AUTO
(23)
HEALTH and Food
(195)
TESTIMONIALS (References)
(0)
SPORTS
(12)
IT and AI
(70)
Accessories
(0)
News
(167)
Pet
(15)
Visiting Place News
(24)
Style and Fashion news
(25)
Geography News
(0)
Entertainment News
(0)
Random Posts
News
Trump bashes California leaders over Los Angeles fires response
HEALTH and Food
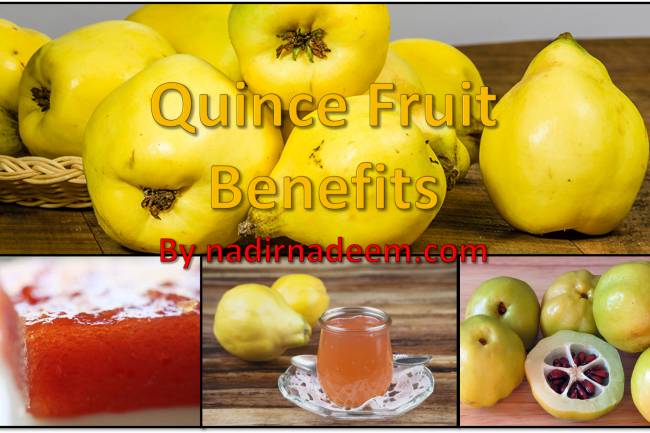
Quince Fruit
HEALTH and Food
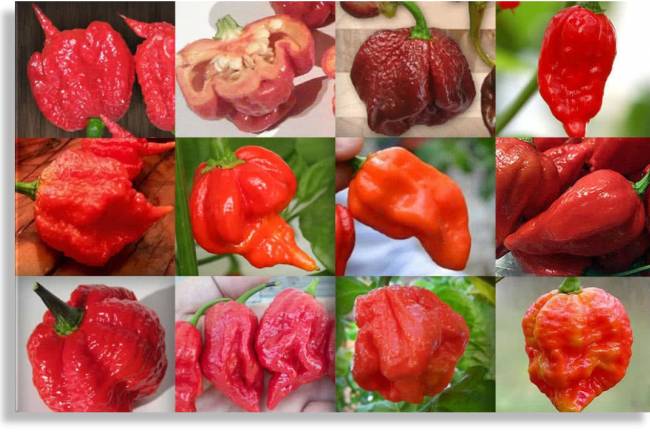
Top 10 Hottest chilies in the world
News
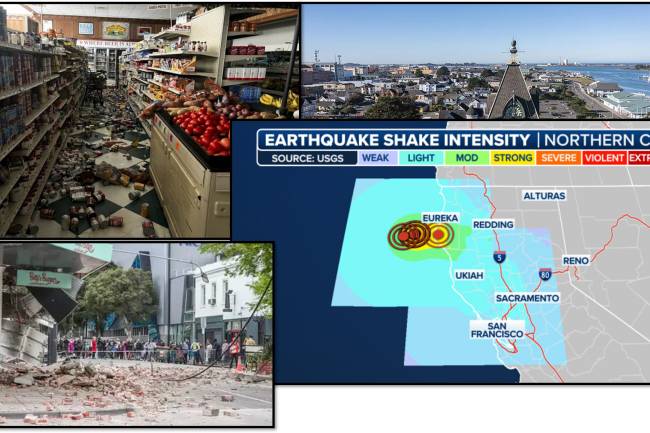
California is shook by 7.0-magnitude earthquake near Eureka
IT and AI
windows defender | security warning | Recovery | image with Update
Tags
Owala Eco-Friendly Bottles
Healthy Snacking
regulations
mindful meditation
PLC in CNC Deep Hole Drilling
My Neighbor Totoro
Waffle Tacos
Mouthwatering Creations
Nutrient-Packed Mornings
Thunderbolts
Clarity of mind
PLC in Aerospace Industry
Pixel 8 Photography Community
Playoffs
Brings people together to share stories and laughter
Your browser does not support the canvas element.