Tag : Power
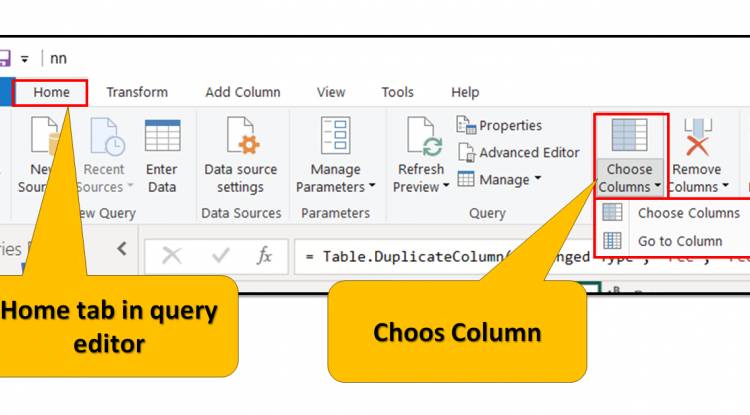
Home Tab in Query Editor: "Choose Column" option in home tab of query editor in Power BI: Lesson-7 P-18
The "Choose Columns" option in the Home tab of the query editor in Power BI provides an easy way to select specific columns from a dataset during the data transformation process. This feature is particularly useful when dealing with large datasets containing multiple columns, allowing users to streamline their data by selecting only relevant columns for analysis or visualization.
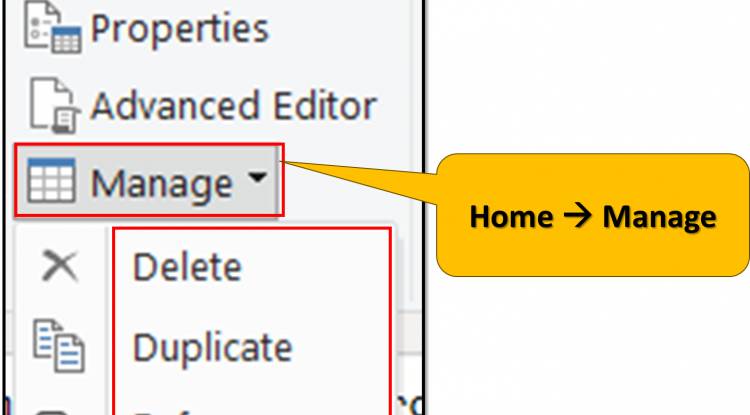
Home Tab in Query Editor: "Manage" option in home tab of query editor in Power BI: Lesson-7 P-17
Certainly, here are 3 thins related to the "Manage" option in the Home tab of the query editor in Power BI, specifically focusing on "Delete," "Duplicate," and "Reference": Delete query, Duplicate query, Reference copy query.
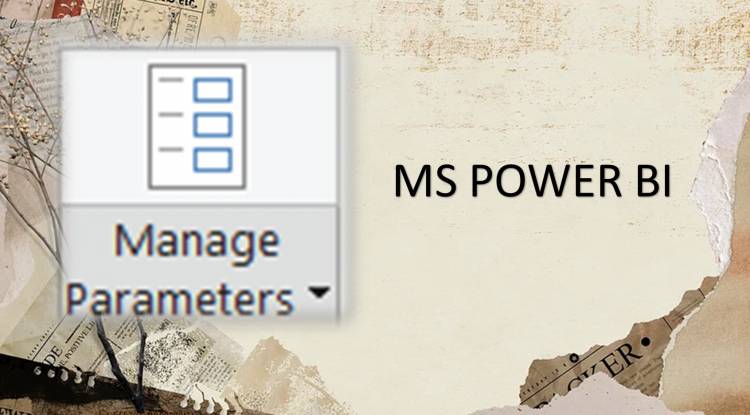
Home Tab in Query Editor: "Manage Parameters" option in home tab of query editor in Power BI: Lesson-7 P-16
In Power BI, managing parameters allows you to control how your reports dynamically filter or adjust data based on user input. Here's a breakdown of the three key options under "Manage Parameters".
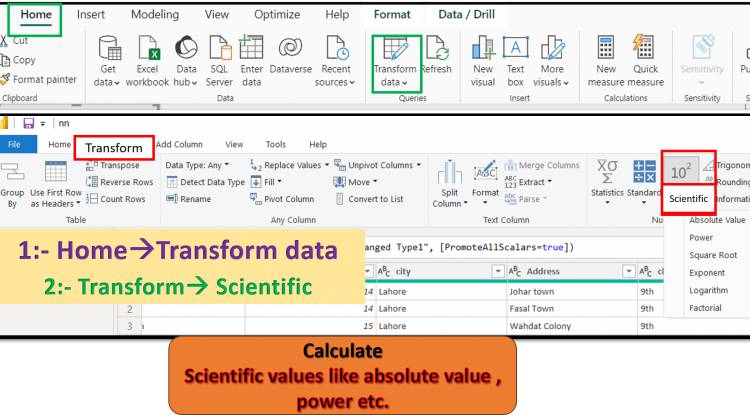
Transform Tab in Query Editor: Statistic option of query editor like absolute value, power, square root, log etc. in Power BI: Lesson-7 P-9
The data options available in Power BI's query editor provide various mathematical functions and operations for manipulating and analyzing data. These include: Absolute Value: Returns the absolute (positive) value of a number. Power: Raises a number to a specified power. Square Root: Calculates the square root of a number. Log: Calculates the logarithm of a number. Exponential: Calculates the exponential function.
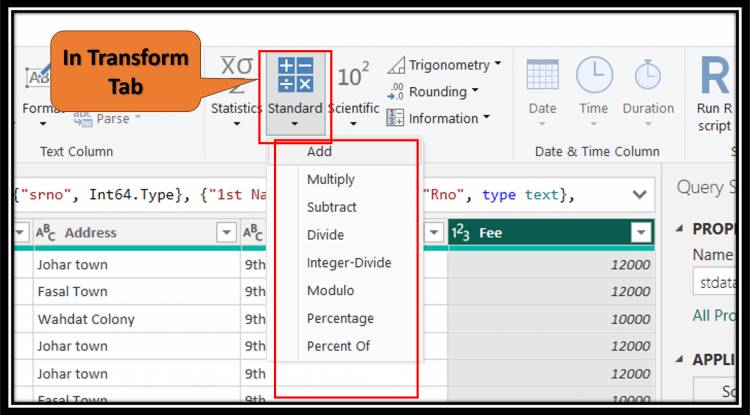
Transform Tab in Query Editor: The "standard" options in Power BI's Query Editor', such as Add, Multiply, subtract...: Lesson-7 P-8.2
The "standard" options in the Transform ribbon of Power BI's query editor, such as Add, Subtract, Multiply, etc., are basic math operations for numeric columns in your dataset. They allow you to perform basic calculations directly in Power BI, facilitating data manipulation without the need for external tools or scripts.
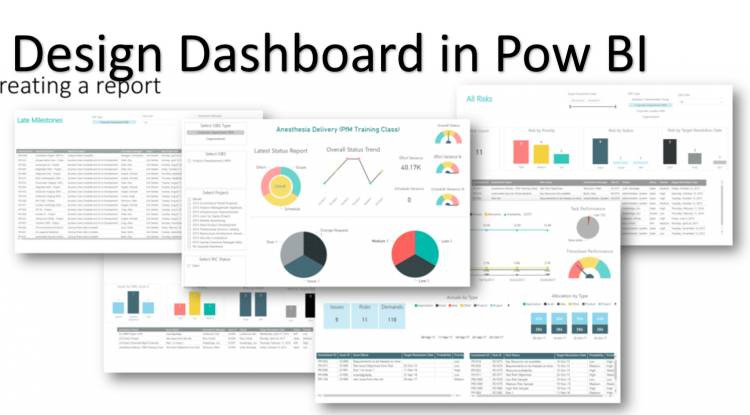
Creating a dashboard in Power BI involves several key steps and considerations. First, you need to connect your data sources to Power BI and import the relevant datasets. Then, you can start designing your dashboard by adding visualizations such as charts, graphs, and tables to convey insights effectively. Power BI offers a wide range of visualization options and customization features to tailor your dashboard to your specific needs.
Popular Posts
-


Khewra Mine Salt
28.12.2023 0 Comments -


Google history: When Was Google Founded and By Whom?
31.10.2024 0 Comments -


Waterfalls: Sajikot Waterfall
05.12.2023 0 Comments -


free software download websites for pc
21.09.2023 0 Comments -


10 Latest PLC Technology Trends
21.10.2023 0 Comments -


Magic Spoon Cereal Review
28.10.2023 0 Comments
Categories
- AUTO(23)
- HEALTH and Food(195)
- TESTIMONIALS (References)(0)
- SPORTS (12)
- IT and AI(70)
- Accessories(0)
- News(167)
- Pet(15)
- Visiting Place News(24)
- Style and Fashion news (25)
- Geography News(0)
- Entertainment News(0)
